

Recent Updates
We launched AI learning feature.
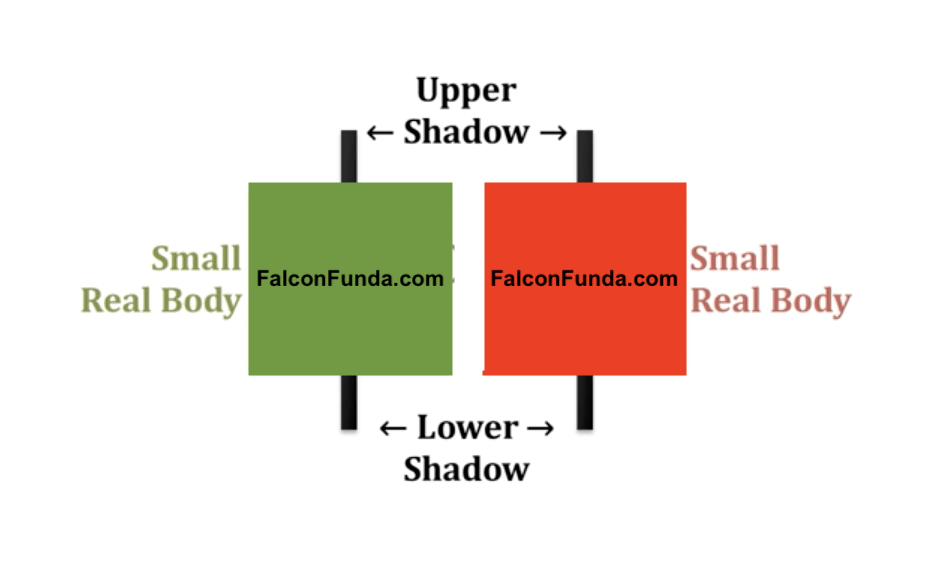
Spinning Top
The spinning top is a single day candlestick pattern. A spinning top has a small real body i.e no difference between the open and close price of the security. It shows that neither bulls nor the bears are in control. Multiple spinning tops may be a signal...
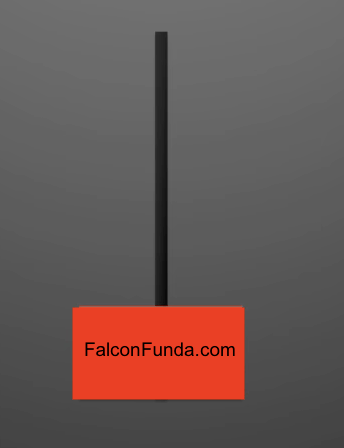
Shooting Star
The Shooting star is a one day potential trend reversal pattern. It usually occurs after an uptrend. Shooting star has a small real body at the bottom of the candlestick with a long upper shadow and little to no lower shadow. Real body can be either bullish or...
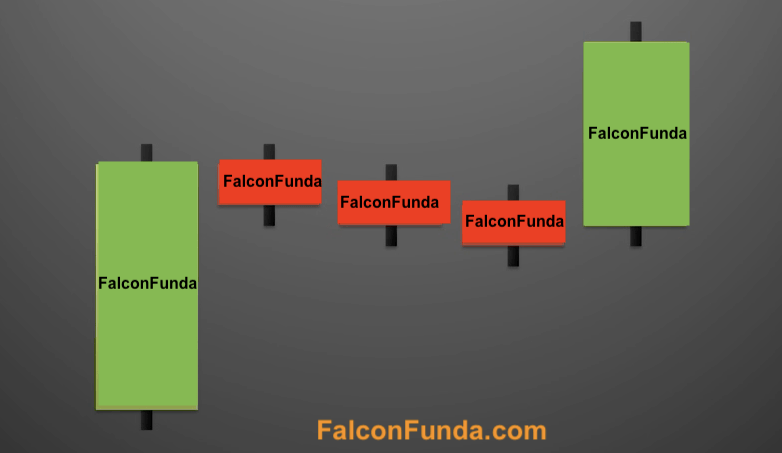
Rising Three Methods Candlestick Pattern
Introduction: Rising Three Methods candlestick pattern is five-day bullish continuation pattern. This pattern provide insights into the market’s psychology, and traders and investors often use them to add to or close positions. What is the Rising Three Methods...

Bullish Piercing Pattern
The Piercing pattern is a two day trend reversal pattern. A Piercing pattern happens after a downtrend. Day one has a longer bearish candlestick. Second day candlestick opens below the previous day low and has a closing day price within...
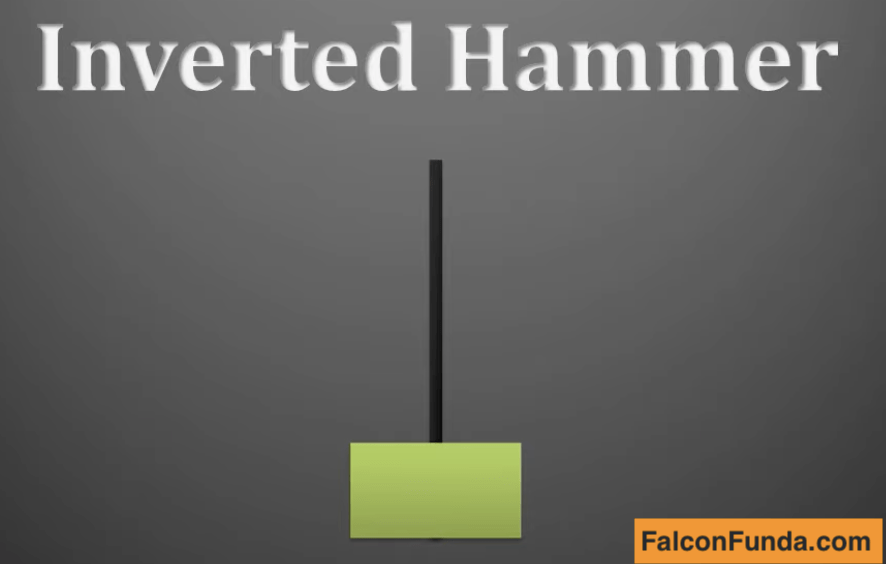
Inverted Hammer
The Inverted Hammer is a single day pattern. Inverted Hammer occurs when the price of the asset being traded goes down significantly lower than the opening price and then bounces back on the same day to close near the opening price. Inverted Hammer Candlestick...
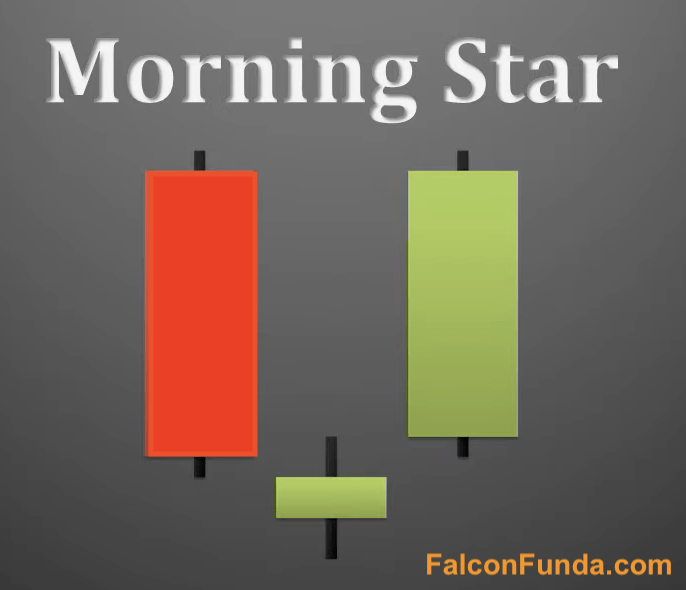
Morning Star
The Morning Star is a three day bottom reversal pattern. The Day 1 of the morning star pattern consists of a long bearish candlestick after a previous downtrend. The Day 2 candlestick gaps down, i.e candlestick opens at a lower price than the first day’s closing...
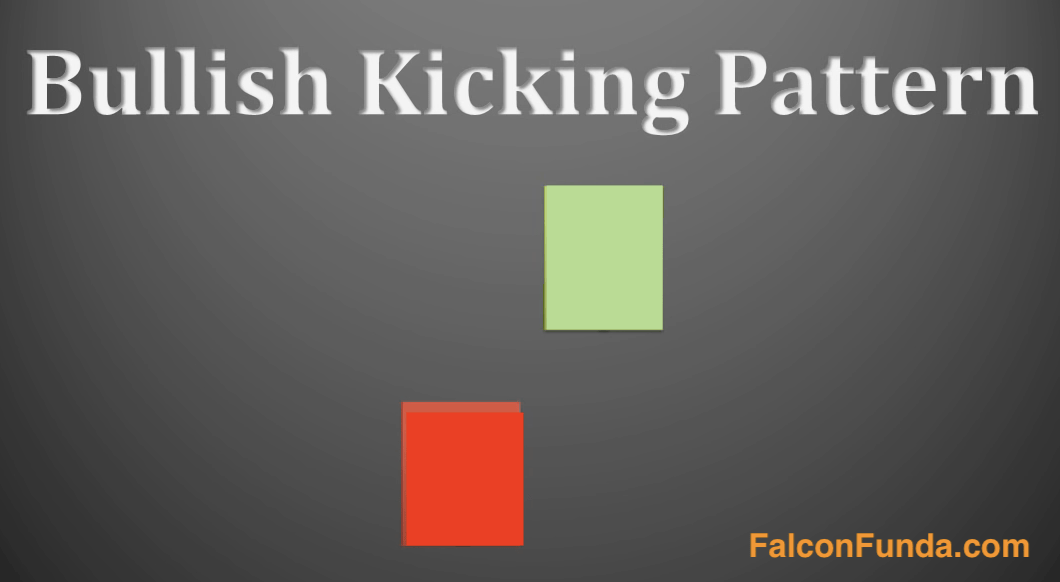
Kicking Pattern
The Kicking Pattern is a two day reversal pattern. Day two candlestick starts an opposite trend to the previous one. A Bullish Kicking Pattern happens to offer a downtrend. Day one candlestick is bearish marabozu ( with no little to no upper or lower...
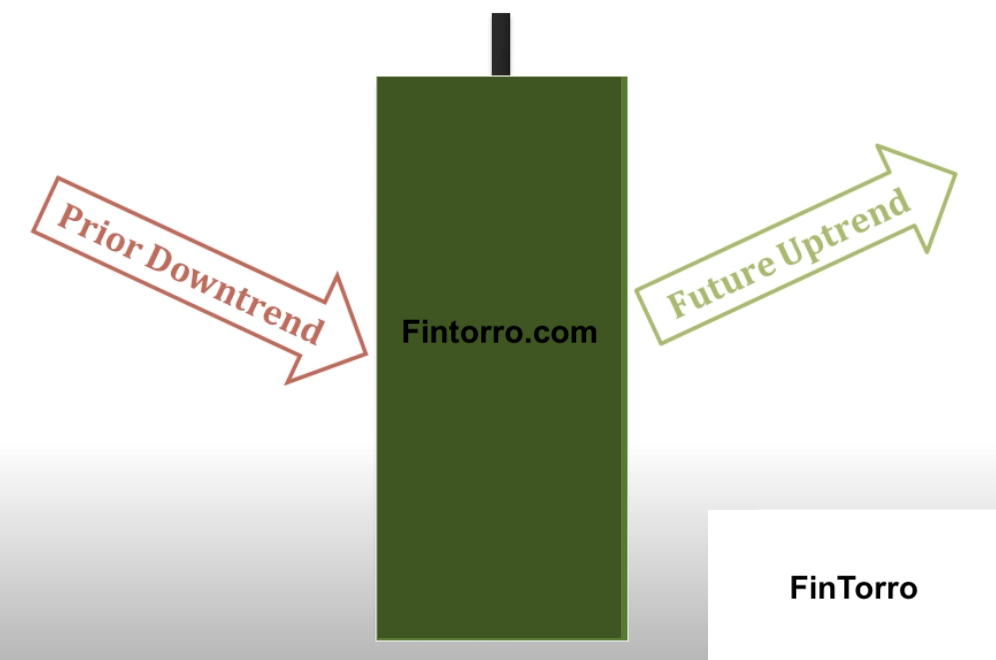
Bearish Belt Hold Lines
Introduction Bullish Belt hold lines is a one day candlestick pattern. It is a single candlestick pattern that occurs during a downtrend and signifies a potential reversal or continuation of the bullish trend. What is Bullish Belt Hold Lines Candlestick pattern? A...
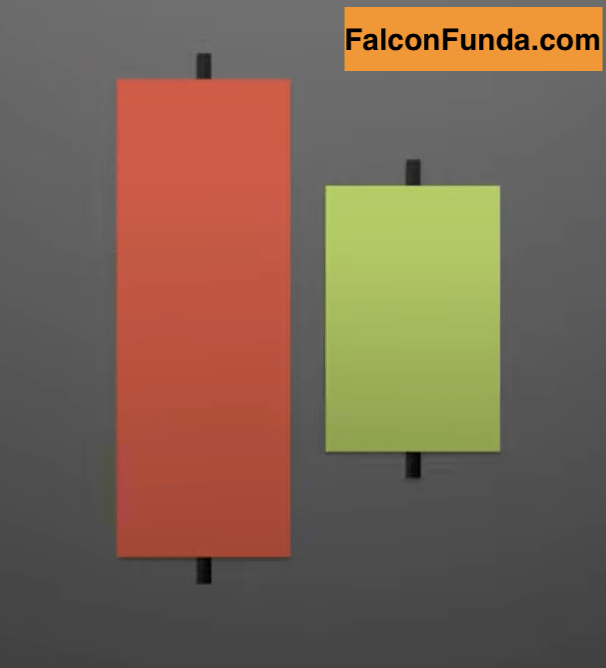
Bullish Harami
The Bullish Harami pattern is a two day pattern. It is made with one bullish candlesticks and a bearish candlestick. This is a potential trend reversal pattern and it is not as significant as a engulfing pattern or hammer. First day a ...