

Recent Updates
We launched AI learning feature.
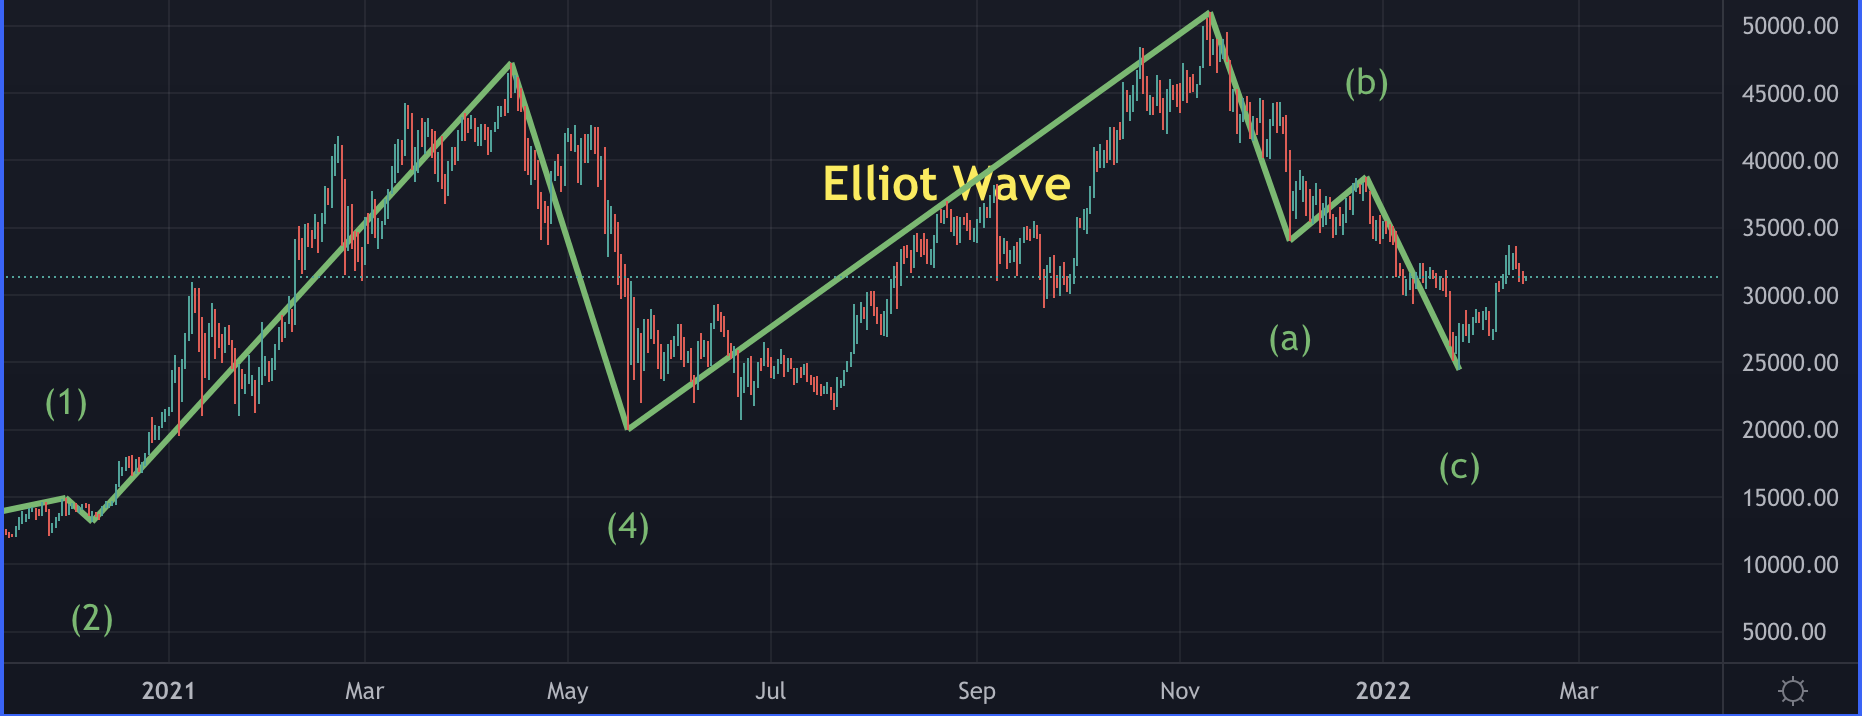
Chart Patterns
Chart pattern is a shape drawn on the price chart to predict future price movements based on the past data. Chart patterns are split into below three types, depending on the price behaviour. 1 Reversal Chart Patterns: They signal the ongoing trend is about to...

Trading Indicators
Traders use Trading Indicator as technical analysis tool on price charts to ascertain market conditions. There are mainly two types of trading indicators Leading Indicator Lagging Indicator When applied on a price chart of a security, Lagging indicators will...

Stock Market
Stock market is a place where public companies list their shares for buyers and sellers to trade.Trading happens in exchange via stock broker and electronic trading platforms.Stock market can be imagined as a collection of Stock exchanges. Trading in the stock...
Windows
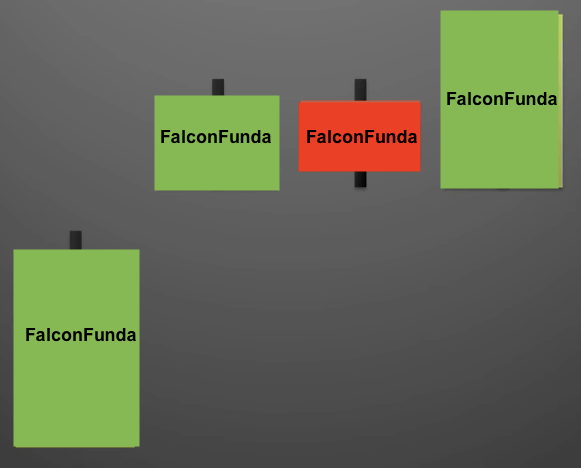
Window is a two day potential trend continuation pattern. Window is a gap between two or multiple day candlesticks on the price chart of a security. A window pattern happens where there is a gap between the high price of Day1 and low price of Day2. ...
Tasuki
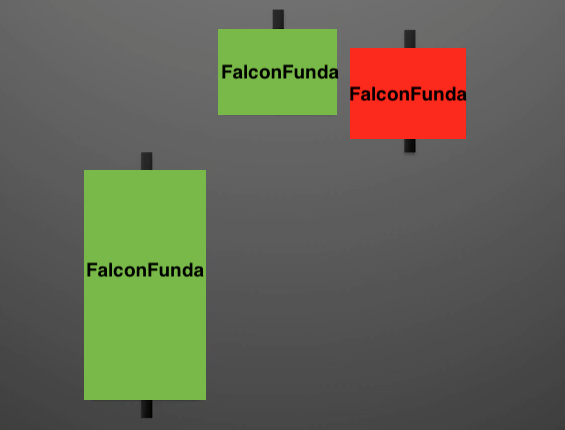
The Upside-Gap & Downside-Gap Tasuki Pattern are three-day trend continuation pattern(s). The Upside-gap Tasuki is a bullish continuation pattern and Downside-gap Tasuki is a bearish continuation pattern. Upside-Gap Tasuki happens during an uptrend. Day1 is a...

Tweezer
The Tweezer Pattern is a two day pattern indicating either a market high or market low. A Tweezer Top pattern has highs of the candlesticks equal and is a bearish reversal pattern. These candlesticks can be of real bodies, shadows or dojis. ...
Upside Gap Two Crows
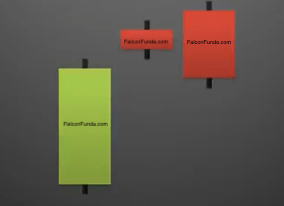
The Upside Gap Two crows is a three candlestick trend reversal pattern. This pattern occurs after an uptrend. Day1 has a longer bullish candlestick. Second day candlestick is a gapped up bearish candlestick and the real body should be above the real...
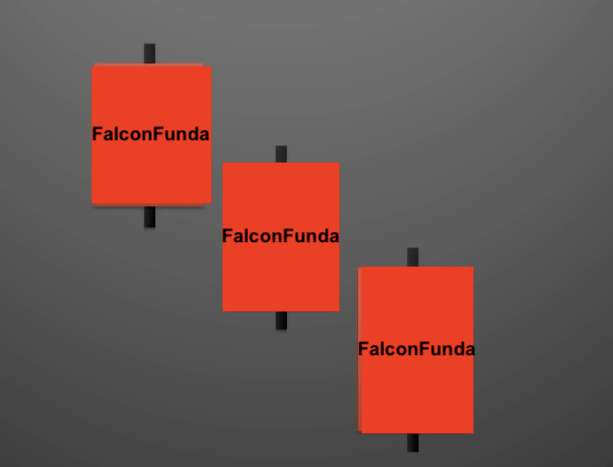
Three Black Crows
The Three black crows is a three day trend reversal pattern. This happens after a uptrend and it has all bearish candlesticks which close near the lower price of that particular day. The open price of each of the candlestick should be with in the real body...
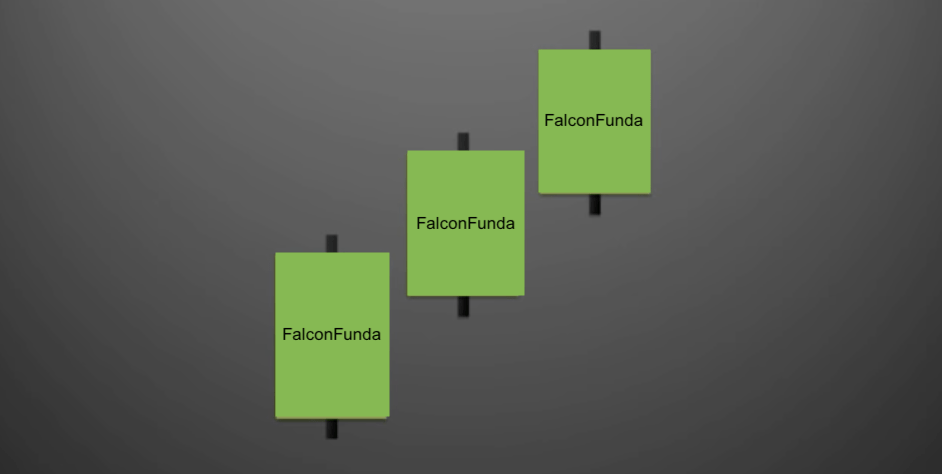
Three White Soldiers
Three white soldiers is a three day trend reversal pattern. This pattern happens after a downtrend. It consists of three large bullish candlesticks with each of them closing higher than the previous one. Each of these candlesticks should open within the...