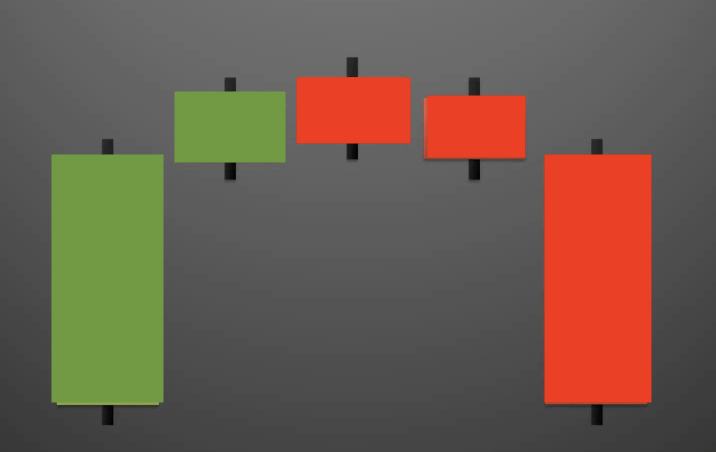
Tower Top and Tower Bottom Pattern
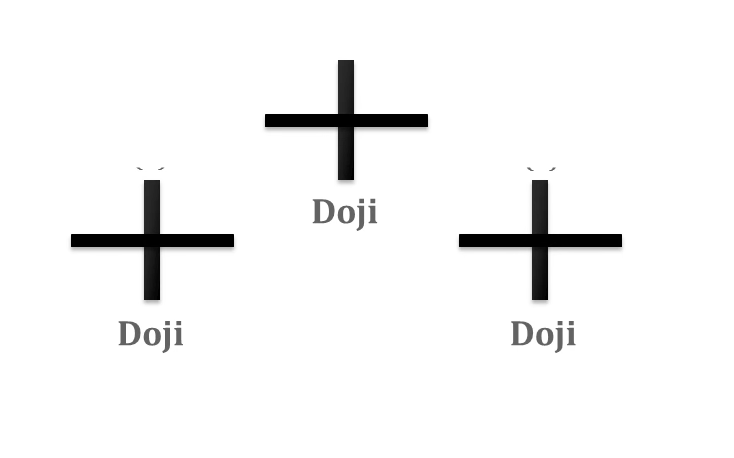
Tri-Star Pattern
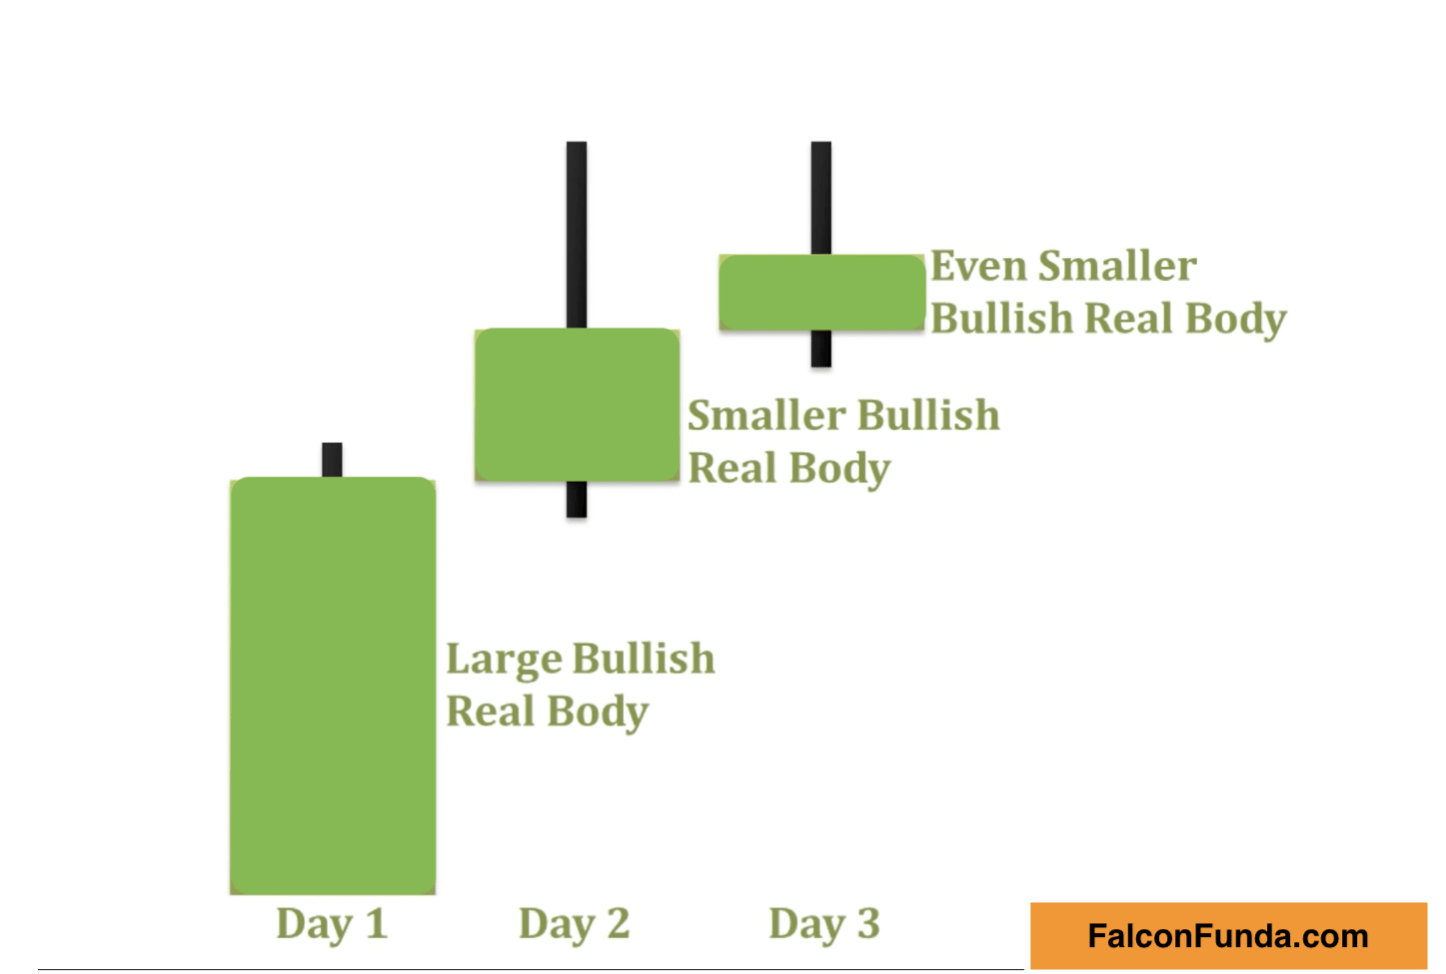
Advance Block Pattern
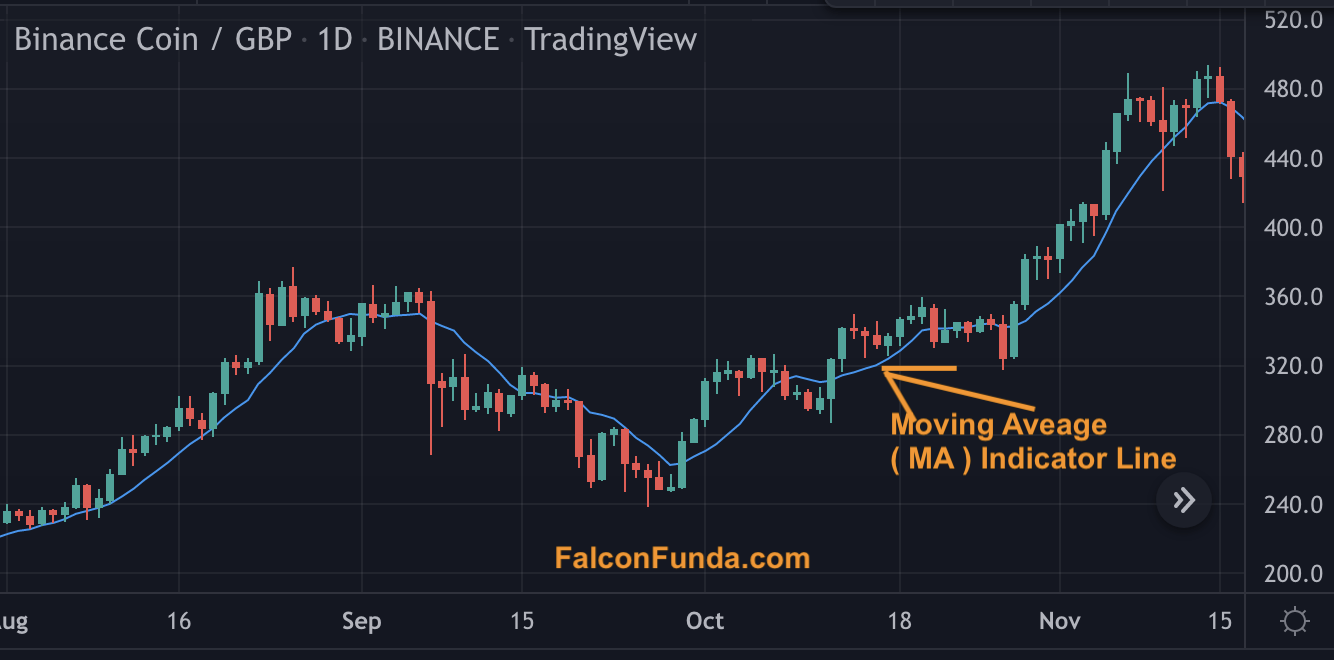
A Beginner’s Guide to Using Moving Averages in Technical Analysis

FinTorro.com sponsoring prizes at The London Investor Show 2022!

Top 10 people to follow in crypto & blockchain

10 must read books for a beginner financial trader and investor!