If you’re a beginner trader, chances are you’ve heard this one before: Trading is as much about psychology as it is about strategy. And you know what? It’s absolutely true. When I first dipped my toes into trading, I thought it was all about charts, patterns, and numbers. But over time, I learned that how you manage your emotions can make or break your trading career.
In this article, I’m going to walk you through why trading psychology is crucial for beginners and how you can master your emotions to become a more successful trader. Believe me, once you get the hang of it, trading won’t feel like such an emotional rollercoaster anymore.
What is Trading Psychology?
Before diving into tips and strategies, let’s first understand what trading psychology really means. At its core, it’s the study of how emotions and mental state affect your trading decisions. Emotions like fear, greed, hope, and frustration can all influence how you approach the market—and, more importantly, how you react when things don’t go according to plan.
As a beginner, it’s easy to get swept up in the thrill of making a trade, but when the market goes against you, your psychological responses can cloud your judgment. That’s why it’s important to understand how emotions play a role in trading and how to manage them effectively.
Why Trading Psychology Matters for Beginners
You might be thinking, “I’m just here to follow a strategy, not deal with emotions.” I get it. But trust me, trading isn’t as straightforward as it seems. And the sooner you learn to manage your emotions, the sooner you’ll see consistent results. Let me explain why trading psychology is especially important for beginners:
1. Fear of Loss
I remember my first few trades like they were yesterday. Every time the market moved against me, I felt a tight knot in my stomach. Fear of loss is natural, but when it becomes overwhelming, it can lead to irrational decisions. This fear can make you exit a trade too early, cutting your losses prematurely, or avoid taking good trades because you’re afraid of losing money.
The key here is to recognize that losses are part of the game. No trader wins every single trade, and it’s crucial to accept that losses will happen. The goal is to keep them small and manageable. One of the most important things I learned early on was that protecting your capital is far more important than being “right” on every trade.
2. Greed for Profit
Greed is another emotion that can trip up beginners. I’ll admit, I’ve fallen victim to this one many times. When you make a few successful trades, it’s easy to get excited and think you’ve figured out the market. I would take bigger risks, thinking that more significant gains were just around the corner—until I’d lose more than I gained. Greed can cloud your judgment and push you to overtrade or make impulsive decisions.
To combat greed, set clear goals and stick to your plan. Don’t let the excitement of a winning trade lure you into risky behavior. The most successful traders know when to walk away and not let the “what ifs” drive them to take unnecessary risks.
3. Overconfidence
After a few wins, overconfidence can sneak in and make you feel invincible. It’s like when you’re playing a game, and you’re on a hot streak—you start thinking you can’t lose. This is dangerous territory, and trust me, I’ve learned this the hard way.
Overconfidence can make you take on trades without the necessary analysis or preparation. It’s like walking into a casino thinking you’re on a winning streak—you might get lucky for a while, but eventually, the market will humble you. Always remember that no matter how well you’re doing, there’s always risk involved. Being aware of this will help you avoid falling into the trap of overconfidence.
How to Keep Your Emotions in Check
So, now that you know why trading psychology is so crucial, let’s talk about how you can keep your emotions in check. Here are some strategies that have helped me stay grounded, and I’m sure they’ll help you too.
1. Set Realistic Expectations
One of the biggest mistakes beginners make is expecting to get rich quick. I get it—when you see others sharing their big wins on social media, it’s tempting to think that’s the norm. But trading is a marathon, not a sprint. Set realistic goals for yourself, and understand that you’ll have both good and bad days.
When I first started, I thought I could double my account in a month. Spoiler alert: It didn’t happen. But by setting smaller, more achievable goals, I learned how to manage my expectations and not get frustrated when things didn’t go as planned.
2. Create a Trading Plan and Stick to It
One of the best ways to combat emotional decision-making is to have a solid trading plan. A plan is like a roadmap for your trades—it tells you when to enter, when to exit, and how much risk to take. Having this framework in place helps you make decisions based on logic, not emotion.
When I first started trading, I didn’t have a plan, and that’s when emotions took over. I would enter trades on a whim or try to chase the market. But once I started sticking to a clear strategy, I felt more in control, and my trading improved. Even if things didn’t go my way, I could look at my plan and evaluate what went wrong without getting emotional about it.
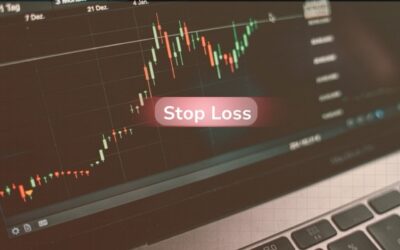
3. Use a Stop Loss
A stop loss is a fantastic tool for managing your risk and controlling your emotions. By setting a stop loss, you automatically limit the amount you’re willing to lose on a trade. This helps prevent panic selling and gives you peace of mind knowing you won’t lose more than you can afford.
For example, if you’re trading a stock and it starts moving against you, your stop loss will automatically trigger, closing the trade before your losses become too big. Having this “safety net” in place allows you to stay calm, even when the market doesn’t go your way.
4. Don’t Chase Losses
This one’s huge. When you have a losing trade, it’s easy to get caught in the cycle of trying to recoup your losses. You might think, “I just need to make this money back,” and enter another trade without proper analysis. This is known as revenge trading, and it’s a slippery slope.
When I had my first major loss, I made the mistake of revenge trading. I took a series of bad trades, thinking I could make up for the losses quickly—and it only led to more losses. The key is to walk away and take a break after a losing trade. Don’t let a single loss derail your entire trading plan.
5. Practice Mindfulness
Trading isn’t just about numbers and charts; it’s about being in the right mental state. Practicing mindfulness can help you stay calm, focused, and in control of your emotions. Whether it’s through meditation, deep breathing, or just taking a walk, mindfulness can help you clear your mind and reduce the emotional stress that comes with trading.
Personally, I started incorporating short meditation sessions before I traded, and it made a huge difference in how I approached the markets. I felt less stressed and more centered, which helped me make better decisions.
Conclusion
Trading psychology for beginners is something that takes time to master. It’s not about trying to eliminate emotions entirely, but about understanding and managing them. By setting realistic expectations, creating a trading plan, using tools like stop losses, and practicing mindfulness, you can keep your emotions in check and improve your trading performance.
Remember, trading is a marathon, not a sprint. It’s about steady growth and learning from both your wins and losses. If you can manage your emotions, stick to your plan, and stay patient, you’ll be well on your way to becoming a successful trader.
So, take a deep breath, and trade smart—not with your emotions. Your future self will thank you for it!
Next Article To Read: Trading on a Budget? Here’s How to Maximize Your Small Account