Recent Updates

We launched AI learning feature.

Volume

Volume

Volume is the total quantity of a particular security traded during trading hours on a given day or per transaction.

For a given security, higher day trading volumes are considered more positive than the lower trading volumes because they mean more liquidity and better order execution.

Volume tends to be highest near the market day open, market day close and also on the start of the week and last day of the week. Volume of a trade ( Trade Volume)  is the measurement of the market’s activity and liquidity during a set period of time. This is measured on stocks, bonds, options, contracts, future contracts and all types of commodities. 

Traders use volume levels to decide on timing of their  transaction. When the price of a security is changing fast then it means that Trading Volume is usually higher. 

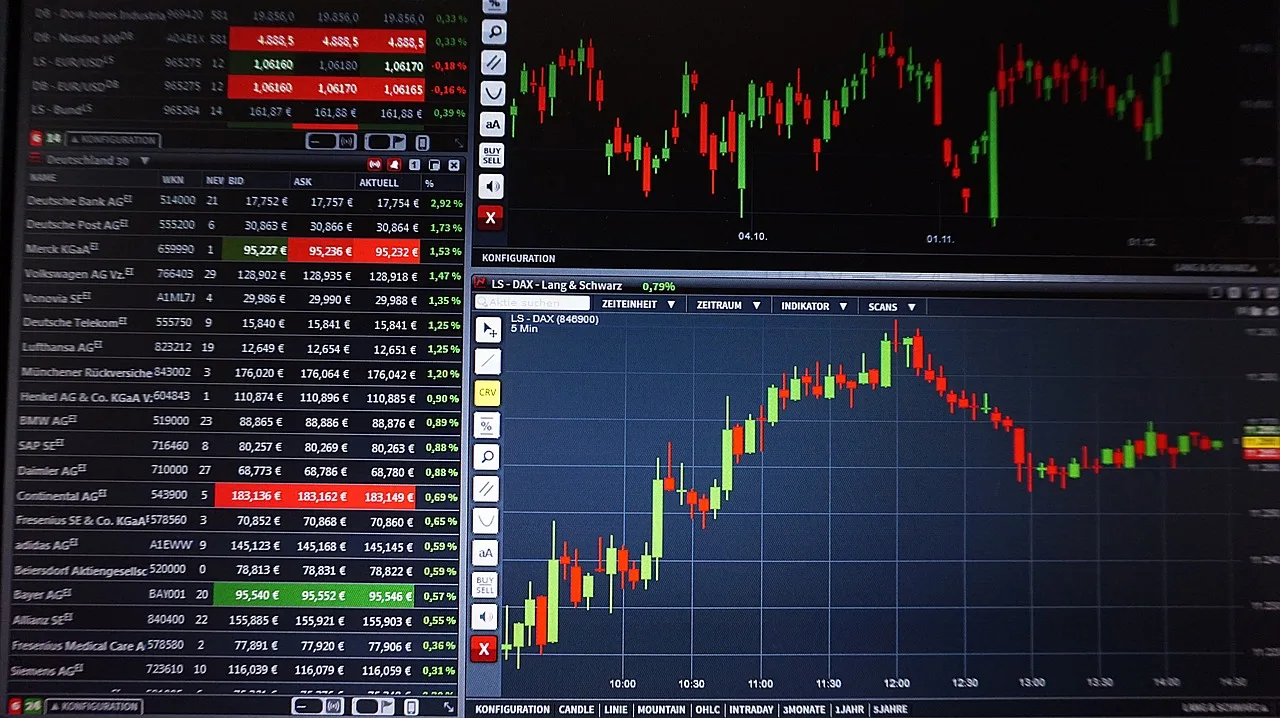
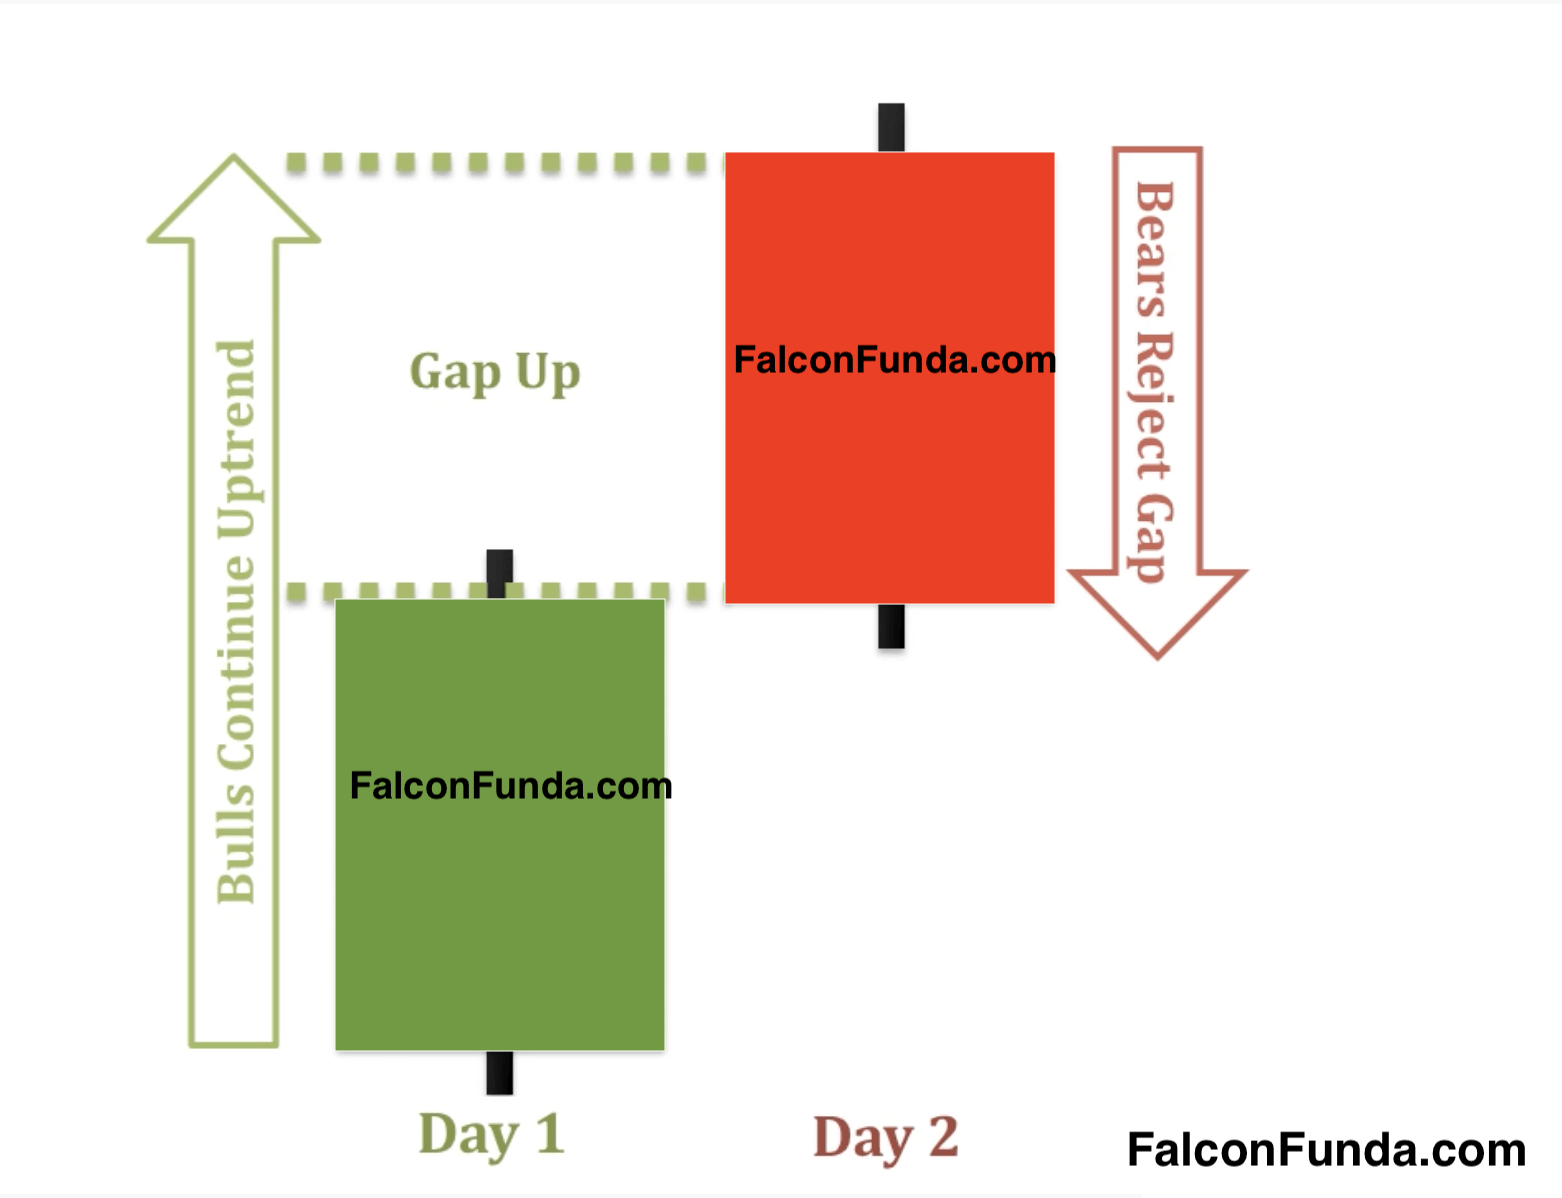
Candlestick charts primarily highlight price movements of the security. Volume indicators keep track of all the transactions  in any given period.

Trades usually apply volume indicators on the price chart  of the security to analyze patterns. On the candlestick chart, volume indicators are usually displayed at the bottom as a histogram. Each bar shows the total volume traded for a given time  period with a number.

Volume - Example Price Chart

Volume – Example Price Chart


Practice Volume – Beginner

Practice Volume – Intermediate

Practice Volume – Expert


Orders

Orders

In Trading an order is a set of instructions to a broker to buy or sell an asset on a trader’s behalf. An order can be used to buy and sell securities like stocks, currencies, futures, commodities, options, bonds and other securities.

Exchanges trade securities through a bid/ask process i.e buyer will be matched with the seller and vice-versa.
There are multiple order types which will affect price the investor buys or sells a security at,  when they will buy or sell and also whether the order will be filled or not.

Trader will  choose the order type depending on the trader’s strategy  for the security , whether they want to get in and out quickly, and/or how concerned they are about the price they get.

Here are some of the most important order types :

  • Market Order : This type of order from Trader instructs the brokerage to complete the order at the next available price. 
  • Limit Order   : Limit Order from Trader   instructs the brokerage to buy a security at or below a specified price. Here are some sub-types of Limit Order :  Buy Limit, Sell Limit, Buy Stop, Sell Stop
  • Stop Order : This order type from Trader remains dormant until a certain price is passed after which the order is executed as a market order. 
  • Order Types


  • Conditional Order :This type of order from a trader  will only execute if certain specified conditions are met. This will allow  cautious  traders or investors to engage in trades without having to be present   in front of the screen.  Trader has to  first specify a price condition then specify an action if that condition triggers.
  • ConditionalOrder


Buying and Selling

Buying and Selling

When you place a trade, you are either buying or selling a security in the market. Buyers who are buying believe  the security value will likely rise. Sellers ( or Bears ) generally think its value is going to fall. 

Buyers and sellers affect the supply and demand of the security and therefore its price. A long position in trading is when you buy a security and short position is when you sell it. When buyers outweigh demand increase and price of the asset rises. When sellers outweigh buyers, supply increases and demand and price drops.

Traders / Investors typically will use a broker account to purchase securities

Buying-And-Selling

Buying-And-Selling Vs Security Price Impact

Practice Buying and Selling – Beginner


Market Price

Market Price

In trading, price is the most recent price at which a particular security was bought or sold.The price of the security is mainly determined by the supply and also demand.

Traders, Investors and Dealers interact in the market to determine the supply and demand which in turn indicates the market price of the security. So the price of the security is constantly changing  as the supply and demand quantities change. 

Bid represents Buying and it is the highest price at which a buyer  trader is willing to pay for a security.
Offer ( or Ask ) represents Selling and it   is the highest price which a seller trader  is willing to accept for a security.

Trading  transaction of a security occurs when the Bid and Offers coincides. 
Bid-ask (or Bid-offer spread ) is the difference between the bid price for the security and the ask price.
Exchanges provide a platform for traders to submit Bids and Offers through Brokers ( called market makers).

Practice Market Price – Beginner


Securities

Securities

Security is a tradable financial asset that holds some type of monetary value.
Securities are broadly categorized into:

  • Debt securities (Example :  banknotes, bonds, and debentures
  • Equity securities (Example  stocks)
  • Derivatives (Example : , forwards, futures, options, and swaps).

The company or the entity issuing the security is called the Issuer. Every country has its own regulatory structure which determines security. 

Cryptocurrencies are currently not categorised as securities. 

Debt Security :
A debt security represents borrowed money that must be repaid.  The issued security ( usually a paper contract – examples:  corporate bonds, certificates of deposit, collateralized securities   ) has details like the size of the loan, interest rate, and maturity or renewal date and other stipulated contractual rights. 
Investors ( rather than traders ) usually buy these debt securities and they will be entitled to regular payment of interest and repayment of principle (regardless of the issuer’s performance)

These debt securities are typically issued for a fixed term, at the end of which they can be redeemed by the issuer.

Equity Security:
An equity security is basically shares  in a company, trust or partnership. The holder of an equity is called a shareholder, owning a share, or fractional part of the issuer. 

Derivatives :   
A derivative is a contract that derives its value from the performance of an underlying entity. This contract between two parties defines all the  conditions ( especially the dates, resulting values and definitions of the underlying variables, the parties’ contractual obligations   ) under which the payment will be made between the parties.


Practice Securities – Beginner


Brokers

Brokers

A  broker is an individual or a company who facilitates financial transaction execution on behalf of a trader. They basically act as sales agents. 

There are mainly four types of broker in financial trading

Stock broker : Stock broker manages and executes the buying and selling of securities for the traders.
Forex broker :Forex brokers buy and sell  currencies for the traders.
Full-service broker :Full-service brokers are financial advisers and offer more services for traders / investors  ( on top of buying and selling ). Example tax advice, research, financial  planning. 
Discount broker : Discount brokers offer lower commission for executing the trades for the traders. The more trades you execute with them, the lower the cost.

Practice Brokers – Beginner

Bullish and Bearish Counterattack Candlestick Pattern

Bullish and Bearish Counterattack Candlestick Pattern

Introduction

Bullish Counterattack Lines is a two-day trend reversal pattern with one bullish candlestick and a bearish candlestick.


Bullish Counterattack Lines

What is Bullish Counterattack Candlestick  pattern?

A bullish counterattack line or bullish meeting line occurs during a downtrend. 
The first day is a bearish candlestick.
The second day is a large bullish candlestick. It opens far below the close of the first day’s bearish candlestick but then rallies back, closing at roughly the same price as the first day’s candlestick closing price. 

Why is Bullish  Counterattack Candlestick pattern important ?

The psychology of the Bullish counterattack line pattern is that a significant gap down on the second day gives bears confidence that the downward trend will continue.  but instead of heading further down, prices reverse and fill the gap, and close at the same price level as the previous day’s close. The bulls gained ground on the day. 


Bullish Counterattack Lines - 3 Bullish Counterattack Lines- 2


What is Bearish Counterattack Candlestick  pattern?


Bearish Counterattack Lines - 3

A bearish counterattack line or bearish meeting line occurs during an uptrend.

The first day is a bullish candlestick.
The second day is a large bearish candlestick. It opens far above the close of the first day’s bullish candlestick but then retreats, closing at roughly the same price as the first day’s candlestick closing price

Bearish Counterattack Lines - 2 Bearish Counterattack Lines - 1 Bearish Counterattack Lines


Why is Bearish Counterattack Candlestick pattern important ? 

The psychology of the Bearish counterattack line pattern is that a significant gap UP  on the second day gives bulls confidence that the uptrend trend will continue. Still, instead of heading further up, prices reverse down and fill the gap, and close at the same price level as the previous day’s close. The bears gained ground on the day. This price action signals a potential bearish reversal confirmed on the third or fourth candle on your TradingView Chart

Start Learning

Next Read: 10 Key Questions in your Trading Plan

Doji

Doji

The Doji  is a single day pattern. It is a single candlestick where the open and close price is equal or very close to be the same. 
Doji indicates indecision in the market and is considered as a trend reversal pattern. 
Psychology of Doji pattern is 
When  a market is at an uptrend and a Doji appears then neither the bears nor the bulls have the ability to push prices in their direction.  This inability or indecision to move the markets in one direction will be seen as a trend change candlestick pattern.

For example, if Doji appears after an uptrend, it shows that bulls are unable to push prices much  higher  resulting in traders deciding to sell and pushing the asset  prices lower. This is a Doji  Top Reversal  Candlestick. 
If Doji appears after a downtrend, it shows that bears are unable to push prices much lower resulting in traders deciding to buy and pushing the prices of the asset higher. This is a Doji  Bottom  Reversal  Candlestick. 

The long legged doji is a doji with long upper and lower shadows. When a long legged doji has the open and close in the middle of the upper and lower shadow, it is referred to as a rickshaw man. Dragonfly Doji and Gravestone Doji are other types of Doji.

Doji Doji-1 Doji-2 Doji-3

Practice Doji – Beginner

Practice Doji – Intermediate

Practice Doji – Expert


Dragonfly Doji

Dragonfly Doji

The Dragonfly Doji is a single day pattern. It  has a ‘T’ shape. This occurs when the open and close are the same and there is a long lower shadow and no upper shadow. Having a very small upper shadow is OK.
Dragonfly Doji indicates indecision in the market and is considered as a possible trend reversal pattern. This is bullish candlestick

Psychology of Dragonfly Doji pattern is that market is on a downtrend and on the day when Dragonfly Doji appears bears are able to push prices downwards and then bulls manage to push prices back up. When prices are returned to the day open level the dragonfly doji is complete. It is very common for the lower shadow of the Dragonfly Doji to act as an area of support for future prices. 
Gravestone Doji is the opposite of Dragonfly Doji.

If dragonfly doji appears after a price rise then it can indicate potential price fall of an asset. Look at the next day’s candlestick for confirmation. 

Dragonfly Doji Dragonfly Doji - 3 Dragonfly Doji -1 Dragonfly Doji -2

Practice Dragonfly Doji – Beginner

Practice Dragonfly Doji – Intermediate

Practice Dragonfly Doji – Expert

Exchanges

Exchanges

An exchange is a physical location or virtual / electronic based which provides opportunities for traders for buying and selling financial assets like Shares, Forex, Indices, Commodities, Crypto currencies.

Shares -These are small units of  ownership in a company, such as Apple, Google, HSBC.
Indices -This indicates group of companies, represented as a single number, eg the FTSE 100, S&P 500, Nikkei 225.
Forex – These are global currencies, including the pound, dollar, euro.
Commodities – These are physical assets, raw materials and agricultural products, for example gold, oil, corn.
Crypto currency : A cryptocurrency is a digital or virtual currency that is secured by cryptography, which makes it nearly impossible to counterfeit or double-spend.

Traders use online brokers instead of dealing directly with exchanges. 

Examples of brokers are eToro, ETrade.
Examples of exchanges are London Stock Exchange, New York Stock Exchange, NASDAQ, Coinbase, Binance.

Practice Exchanges – Beginner


Evening Star

Evening Star

The Evening Star is a three day pattern i.e it has three candlesticks. 

The first day is a long bullish candlestick after a preceding uptrend.  Second day is a little  bullish or bearish candlestick. It gaps up i.e opens at a higher price than the first day’s closing price. 
Third day is a large bearish candlestick and it closes into the first day’s bullish candlestick real body, ideally well down into it.

Psychology of the Evening Star pattern is that the market is on an uptrend  and on the first day of the pattern is a large bullish candlestick which reinforces the existing uptrend.
Next on the second day the candlestick opens higher with a gap up showing bulls in control but bears take control and manage to control the price push. This results in a small real body of the candlestick.
On the third day, bears take control and push prices down creating a long bearish candlestick and change in market sentiment to downtrend.

If the second day candlestick is a Doji then the pattern is called Evening Doji star. Evening star and Evening Doji Star are top reversal patterns.

Evening Star Evening Star-1 Evening Star-2 Evening Star-3

Practice Evening Star – Beginner

Practice Evening Star – Intermediate


Hanging man

Hanging man

The Hanging Man is a single day pattern.

It has a none or very little upper shadow and the real body is towards the top of the candlestick. Real body itself can be bullish or bearish. For real impact, the lower shadow of the hanging man should be at least two times the height of the real body. 

Hanging man occurs during an uptrend and can signal the top of that uptrend. Trader has to wait for confirmation of the hanging man’s impact with the  next trading day session close and make sure  it is below the hanging man’s real body. 

Hanging man is a bearish trend reversal pattern and occurs during an uptrend and could indicate that the price of the asset might start going down. 

Psychology of Hanging man pattern is that market is in a uptrend  and 

On the market day of hanging man open bears start selling resulting in price decline.During the day, bulls  take over control and push prices back towards the start of the day price. The closing price can be above or below the open, although the close should be near the open in order for the real body to remain small. 

Next trading day after the hanging man appears ,if the price opens lower on the price chart then  traders who bought at the opening or closing of the day might give up and sell resulting in lowering of the asset price. This confirms bears are in control. 

Whereas Hammer indicates potential price reversal to uptrend, Hanging man signals a potential price reversal to downtrend.

Hanging Man-2 Hanging Man -1

Practice Hanging Man- Beginner