Recent Updates

We launched AI learning feature.

Shooting Star

Shooting Star

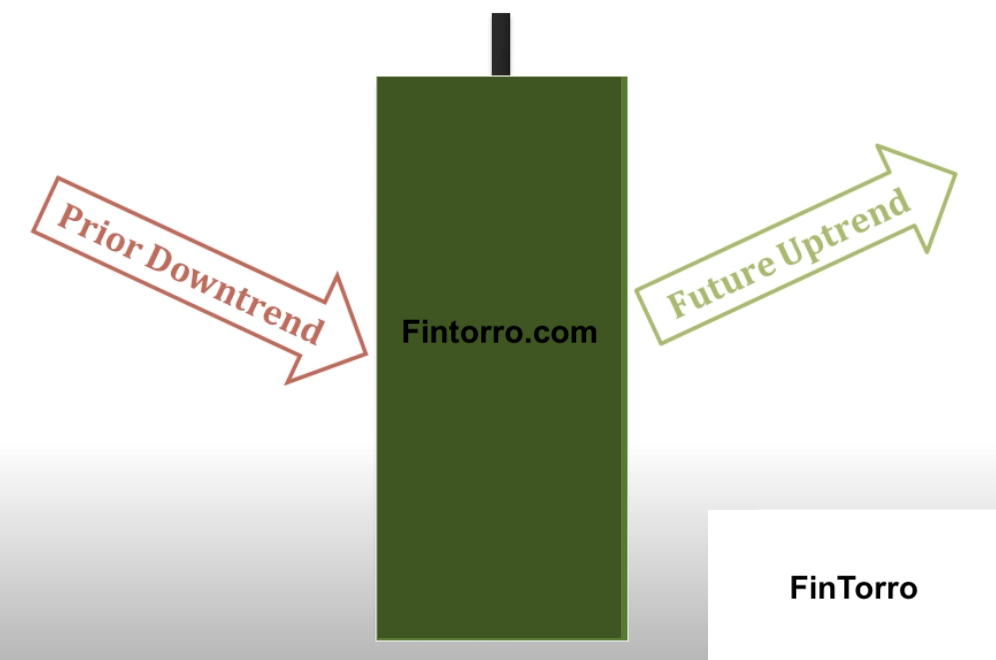
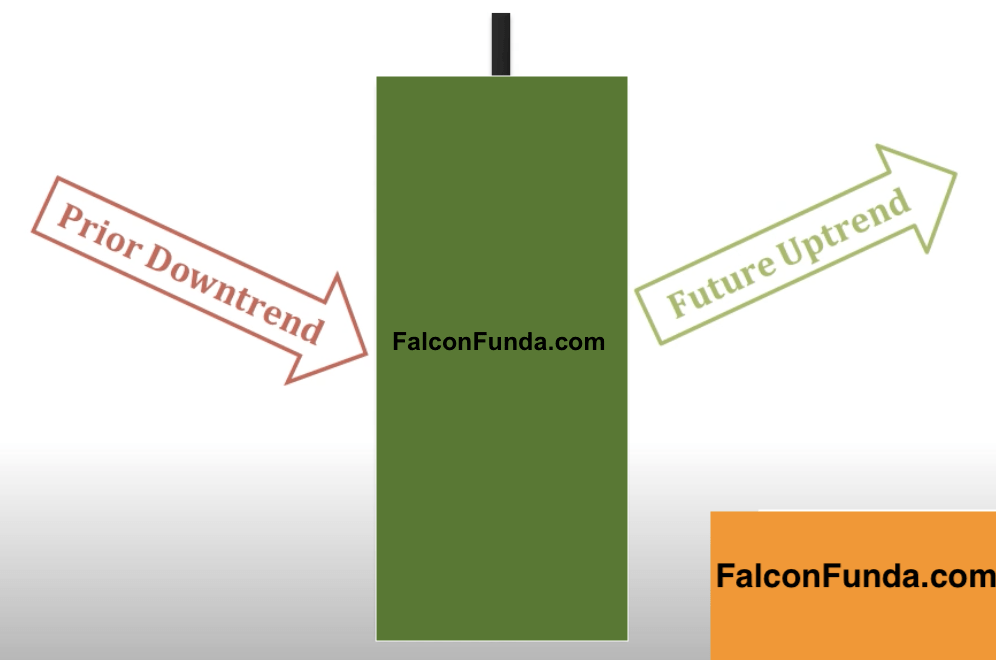
The Shooting star is a one day potential trend reversal pattern. 
It usually occurs after an uptrend.
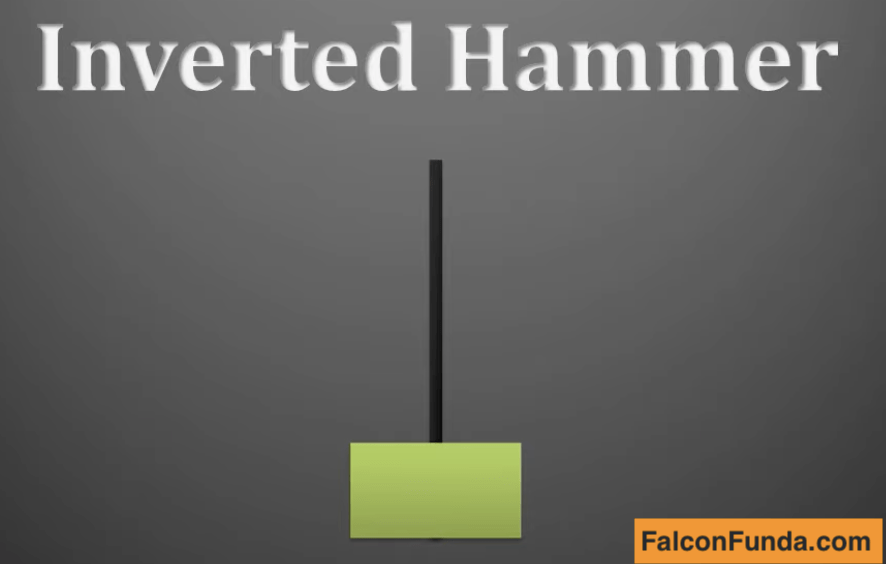
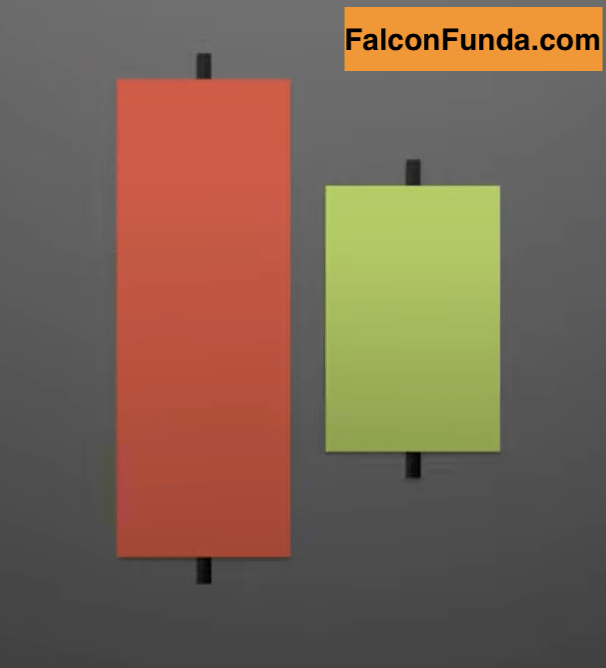
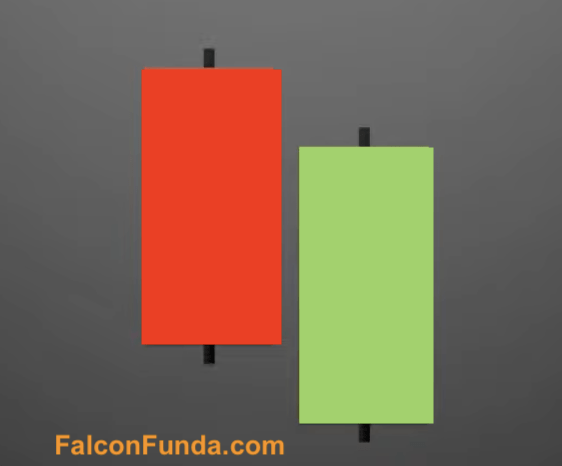
Shooting star has a small real body at the bottom of the candlestick with a long upper shadow and little to no lower shadow. Real body can be either bullish or bearish. Shooting star is usually preceded by bullish candlestick 


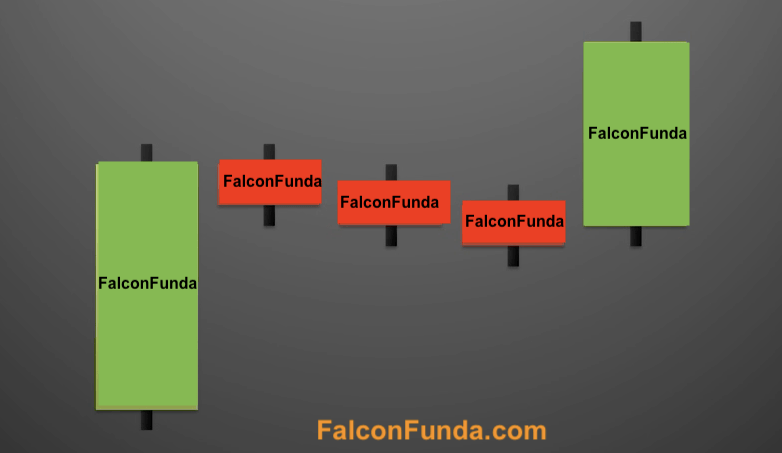
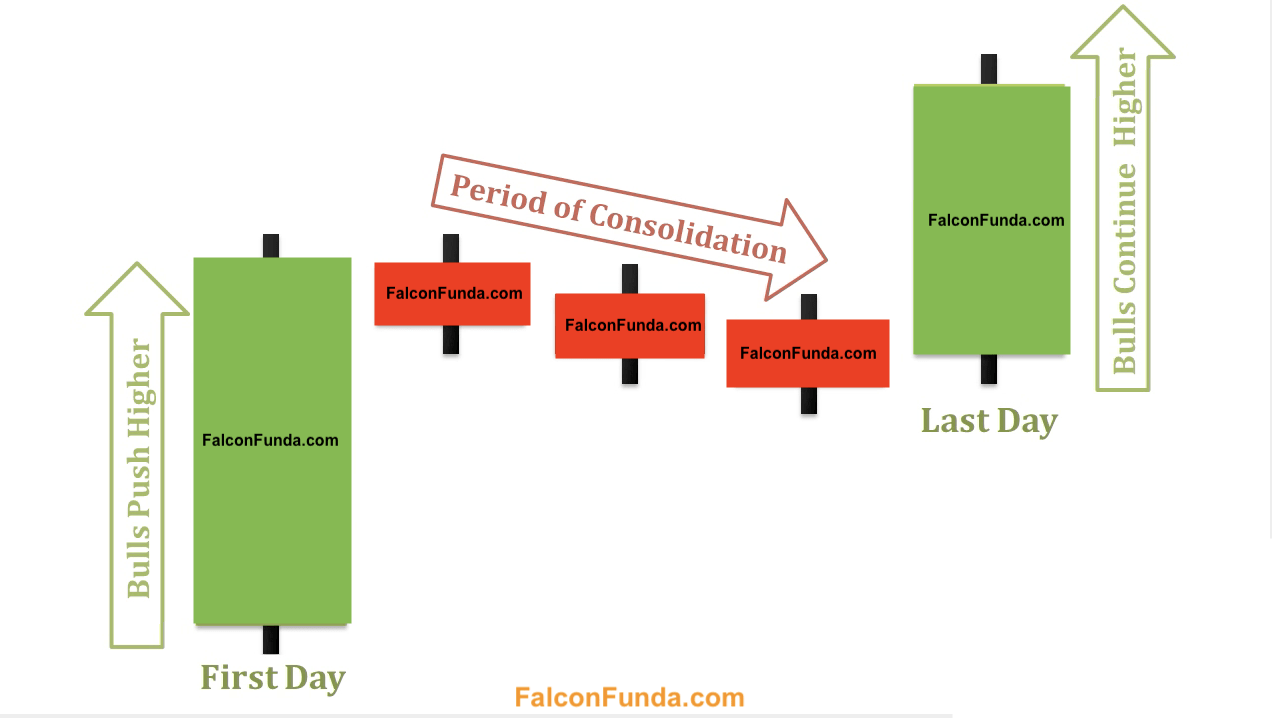
Psychology of  shooting star pattern is that  following an uptrend, bulls  open the day with a gap up from earlier days close and continue to push prices up. However bears are able to push down prices to be close to the start of the day. 
This pattern is also called a bearish inverted hammer.


Practice Shooting Star – Beginner

Practice Shooting Star – Intermediate

Practice Shooting Star – Advanced

Practice Shooting Star – Expert


Rising Three Methods Candlestick Pattern

Rising Three Methods Candlestick Pattern

Introduction:

Rising Three Methods candlestick pattern is five-day bullish continuation pattern. This pattern provide insights into the market’s psychology, and traders and investors often use them to add to or close positions.

What is the Rising Three Methods Candlestick Pattern?


Rising Three Methods 

The Rising Three Methods pattern is a five-day bullish continuation pattern that typically occurs during an uptrend. Here’s how it works:

  • Day 1: A longer bullish candlestick confirms the previous uptrend.
  • Days 2 to 3: Small real body candlesticks, whether bullish or bearish, consolidate the trend.
  • Day 5: A large bullish candlestick closes above Day 1’s closing price, indicating that the bulls are continuing to dominate.

Why is the Rising Three Methods Candlestick important?

Traders and investors often use the Rising Three Methods pattern as a signal to add to long positions. It’s a sign that the uptrend has enough momentum to continue, and traders can benefit from riding the trend.


Rising Three Methods-3

How to Identify the Pattern ?

To identify the Rising Three Methods and Falling Three Methods patterns, you can use indicators on your TradingView chart. However, it’s important to note that these patterns require confirmation in the following days. If the future day candlesticks break the pattern, then it’s voided.

Conclusion:

The Rising Three Methods patterns are useful tools for traders and investors looking to capitalize on market trends. By understanding the psychology behind these patterns, you can make more informed trading decisions.


Next Read: Falling Three Methods Candlestick Pattern

Start Learning

Bullish Piercing Pattern

Bullish Piercing Pattern


The Piercing pattern  is a two day trend reversal pattern. 

A Piercing pattern  happens after a downtrend. Day one has a longer bearish candlestick. Second day candlestick opens below the previous day low and  has a closing day price within ( more than 50% into )  day1 real body. 


Bullish Piercing Pattern-4

 Bullish Piercing Pattern-2   


Bullish Piercing Pattern-5

Psychology of Piercing pattern is that on day one bearish candlestick confirms the previous downtrend. On Day 2 price of the security gaps downward to indicate bears are dominating  but instead of price continuing to go downward, the price begins to rise and ends up going up more than half of the Day 1 candlestick to indicate that bulls are ready to take the prices higher. 

Bullish Piercing Pattern-3

As like any other, piercing patterns require confirmation candlesticks in the following days. If future day candlesticks go below the Day 2 candlestick low then the piercing pattern will be voided. 


Practice Piercing Pattern – Beginner

Practice Piercing Pattern – Intermediate

Practice Piercing Pattern – advanced

Practice Piercing Pattern – Intermediate


Inverted Hammer

Inverted Hammer

The Inverted Hammer is a single day pattern.

Inverted Hammer occurs when the price of the asset being traded  goes down significantly lower than the opening price and then bounces back on the same day to close near the opening price.

Inverted Hammer Candlestick has a small real body either bullish or bearish and a small or no lower shadow with a large upper shadow.  

Inverted Hammer occurs after a downtrend and is a bottom reversal pattern. Traders should wait for the next trading day session for confirmation  of the pattern i.e gap up or strong bullish candlestick. 

Inverted-Hammer-Details-Details

Inverted-Hammer-Details

Inverted-Hammer-Details

Psychology of Inverted Hammer pattern is that market is in a downtrend and On the market day open bears start selling resulting in price decline.During the closing day, bulls  take over control and push prices back up a little bit.  Next trading session gapping up and moving higher confirms the reversal. 

Inverted Hammer candlestick is considered as a bottom  reversal pattern, just like Hammer. 

Practice Inverted Hammer – Beginner

Practice Inverted Hammer – Intermediate

Practice Inverted Hammer – Expert


Morning Star

Morning Star

The Morning Star is a three day bottom reversal pattern.

The Day 1 of the morning star pattern consists of a long bearish candlestick after a previous downtrend.

The Day 2 candlestick gaps down,  i.e candlestick opens at a lower price than the first day’s closing price. It must  be a small candlestick and can be either bullish or bearish; however the key is that the real body of the this candlestick will be  below the real body of the first day. 

The Day 3 is a large bullish candlestick that closes into the first day’s real body. When the Day 2 candlestick is a Doji in the Morning Star then the pattern becomes Morning Doji Star. 

Psychology behind the pattern is Day 1  is a large bearish candlestick that strengthens  the prior continual downtrend. The Day 2 candlestick opens lower than the Day 1 close, thus gapping down and once again shows  that the bears are in control of the market. However, the bears are not able to push prices further downward. The doji, or small real body of the Day 2  shows there is a stalemate between the bulls and the bears. On Day 3  bullish candlestick shows that the  bulls  are now in control of the market.


Practice Morning Star Pattern – Beginner

Practice Morning Star Pattern – Intermediate

Practice Morning Star Pattern – Advanced

Practice Morning Star Pattern – Expert

Kicking Pattern

Kicking Pattern

The Kicking Pattern is a two day reversal pattern. Day two candlestick starts an opposite trend to the previous one. 

A Bullish Kicking  Pattern happens to offer a downtrend. Day one candlestick  is bearish marabozu ( with no little to no upper or lower shadow) . Second day candlestick opens either with a gaps up or at same day1 price level and becomes A bullish marabozu (with little to no upper or lower shadow).

Kicking Pattern occurs when the price of the asset being traded  goes up significantly higher than  the closing price. Candlesticks are mostly marabozu’s.

Psychology of Bullish Inverted Hammer pattern is that on day one bears are completely in control. Day two gap up will indicate substantial change in market psychology with bulls taking control.

Same principle applies to Bearish Inverted Hammer where bears take control on day two.


Practice Kicking Pattern – Beginner

Practice Kicking Pattern – Intermediate

Practice Kicking Pattern – Advanced


Bearish Belt Hold Lines

Bearish Belt Hold Lines

Introduction

Bullish Belt hold lines is a one day candlestick pattern. It is a single candlestick pattern that occurs during a downtrend and signifies a potential reversal or continuation of the bullish trend.

What is Bullish Belt Hold Lines Candlestick pattern?

Belt Hold Line - Bullish
A bullish belt hold occurs when prices open on the low of the day and then immediately move higher creating a long bullish candlestick. The bullish belt hold is also referred to as a white opening shaven top. Prices open on the low of the day and then move to the top for the remaining period, thus creating a long bullish candlestick. 


Why is Bullish Belt hold Lines Candlestick pattern important ?

The psychology behind the bullish belt hold line pattern is as follows:

  1. Opening Price: The pattern starts with a bullish candle that opens at or near the low of the session, indicating buying pressure right from the start. This suggests that bulls are in control of the market sentiment.
  2. Buying Pressure: Throughout the session, buyers continue to dominate the market, pushing the price higher. The candle’s body remains bullish, indicating sustained buying pressure and a lack of selling interest.
  3. No Upper Shadow: One characteristic of the bullish belt hold line pattern is the absence of an upper shadow or a very small one. This signifies that the bulls have maintained control throughout the session without allowing any significant selling activity.
  4. Closing Price: The bullish candle closes near its high, further reinforcing the dominance of bulls in the market. This suggests that buyers are in control until the end of the session, and there is little to no bearish sentiment.

Psychology of this pattern is that investors think the price of the security is highest ( may be future resistance  area! ) and sell, resulting in bearish belt hold. This may result in future downtrend.Bearish belt hold traders think that price is too high and sell (may be future resistance area! ). This might result in future downtrend. Try to observe this pattern on  your TradingView chart.


Belt Hold Line - Bullish

Belt Hold Line - Bullish 2

Start Learning

Next Read:  Three white Soldiers candlestick pattern!

Bullish Harami

Bullish Harami


The Bullish  Harami  pattern is a two day pattern. It is made with one bullish candlesticks and a bearish candlestick. This is a potential trend reversal pattern and it is not as significant as a engulfing pattern or hammer. 
First day a  large bearish candlestick.
Second day is a small bullish  candlestick  whose real body is between the real body of the first day’s large candlestick real body.

Psychology of this pattern is that the market  is in downtrend  and a long bearish candlestick appears, that likely makes a new low.  It is clear that the bears are in charge. However, the second day gaps higher instead of heading lower .  During the second day, the price moves slightly up and down, suggesting that neither the bears nor bulls are in charge. This indecision of the harami pattern suggests that prices could move sideways or could reverse upward because the bears’ downward move has been exhausted.

The harami pattern is not as significant a reversal pattern as an engulfing pattern or hammer.

If the second day of the Bullish  Harami pattern is a doji rather than a small bullish pattern then the pattern is usually called Bullish Harami Cross Candlestick pattern. The Harami Cross Candlestick pattern is a major reversal signal. 

A bullish Harami got its name because it resembles the appearance of a pregnant woman. “Harami” is the Japanese word for pregnant.


Bullish Harami – Beginner

Bullish Harami – Intermediate

Bullish Harami – Expert


Dark Cloud Cover

Dark Cloud Cover

The Dark Cloud Cover is a two day pattern. It is made with one large bullish candlesticks and a large bearish candlestick. This is a trend reversal pattern which occurs on top of an uptrend. 

Dark Cloud Cover is also called Bearish Piercing Line. 

First day is a large bullish candlestick.

Second day is a large bearish  candlestick. It opens above the first day’s high and closes within the price range of the 1st days’ real body. Strictly speaking the bearishness should penetrate more than 50% below the 1st day’s bullish real body. 

Dark Cloud Cover Pattern Definition Detail Dark Cloud Cover Pattern Definition

Psychology of Dark Cloud Cover pattern is that a market is an uptrend and a large bullish candle appears on day 1 making a new high. On Day 2, the market starts with another new high and then the sell off begins resulting in elimination of over half of the gains made previous day.  Basically the new high got rejected and bears are gaining control. 

Dark Cloud Cover pattern can be dismissed if candlestick after the day2  finishes above the high of the dark cloud cover pattern. 

Practice Dark Cloud Cover – Beginner

Practice Dark Cloud Cover – Intermediate

Practice Dark Cloud Cover – Expert

Support and Resistance

Support and Resistance

Support and Resistance is a technical analysis concept / strategy used by traders to refer to the price levels on the charts for a security.

On a chart, resistance is the area around the highest point the price of a security reaches before it is pulled back i.e prices start going down. Resistance levels indicate that there are / will be surplus of sellers for that particular security.

On a chart for a security, support is the lowest point reached before it continues to go up again. 

Support  levels indicate that there are / will be surplus of buyers for the traded asset.


Practice Support and Resistance – Beginner

Practice Support and Resistance – Advanced

Practice Support and Resistance – Expert


Market Sentiment

Market Sentiment

Market Sentiment is the overall consensus about a particular security or market in general. This can be one of Bullish, Bearish or Correction. 

A bullish sentiment describes a market condition when prices are on the rise or expected to grow. The phrase usually refers to the stock market but can also be applied to any security  in markets like  asset classes, bonds, commodities, or real estate.

While there’s no hard and fast rule to designate a bull market, typically, a market is considered a bull when stock prices rise by 20% or more after a 20% decline and before another 20% drop. 

Bull markets are long-term trends and usually last several months or years.

A bearish market sentiment is  one that is in a prolonged period of decline in security prices. Typically, a market is considered bearish when prices of security falls 20% or more from their 52-week high.

A correction market sentiment is a decline of 10% or more in the price of a security from its most recent peak. Corrections can happen to individual assets, like an individual stock or bond, or to an index measuring a group of assets.  Corrections can last anywhere from days to months, or even longer.

While damaging in the short term, a correction can be healthy , adjusting overvalued asset prices and providing buying opportunities. 

Market Sentiment – Beginner

   Market Sentiment – Intermediate


Transaction Costs

Transaction Costs

Transaction costs are  incurred by a trader during buying and selling  a security. These costs are on top of the price of the security that is being bought or sold.Depending on the type of the security, transaction costs can include broker/ commission fee, bid-offer spread, market impact cost, currency exchange fee, stamp duty and other types of taxes. 

A trader should take into account below additional costs before getting into a buy/ sell trade.

1 Commission or Brokerage Fees

A commission or brokerage fee is the fee paid by a trader to the broker for buying and selling securities  on his behalf. It is calculated as a percentage of the total transaction value. 
Commission usually covers expenses for the broker such as transaction fees paid to the stock exchange, order-handling fees. This varies from broker to broker.  Some brokers offer zero commission traders. 

2 Bid-Ask Spread

The bid-offer spread is the difference between the prices a trader is ready to buy a security  and the price at which the broker  is ready to sell that security.
The size of the spread reflects the liquidity position of the stock, as less liquid stocks will tend to have high bid-ask spread. Therefore, under competitive conditions the bid-ask spread measures the cost of making a trade without delay.
Typical bid-offer spreads in large liquidity stocks are about 0.5-1.0%.

Market Impact:

When people buy and sell a security, it adds new information to the market which has an impact on the market price of security. If all other factors remain the same, buying stocks will increase their market price. This is basically market impact. 
So, in case of a very large trade, where a security is  illiquid, the price at which the trade is executed will be higher than the indicated price. 

Practice Transaction Costs – Beginner

Practice Transaction Costs – Intermediate