Recent Updates

We launched AI learning feature.

Bar Chart

Bar Chart

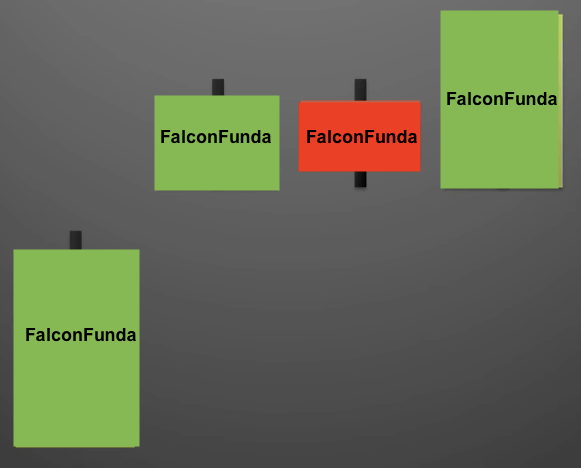
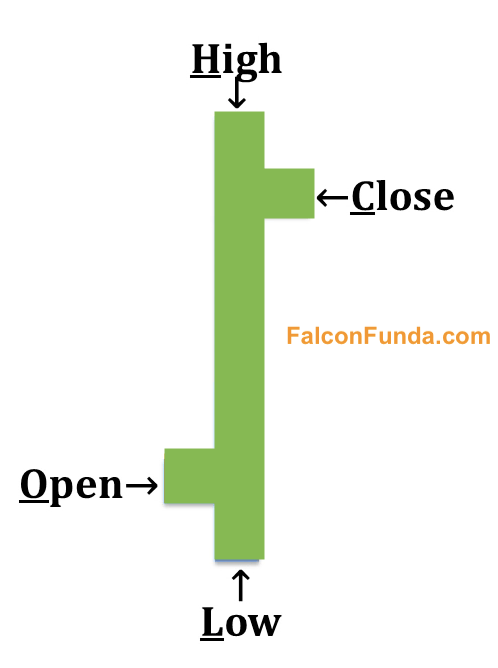
Bar chart is a visual way to represent  Open, High,Low, Closing pricing movements of the security. 
A single bar has a vertical line, left horizontal tick and right horizontal tick.
    Vertical line indicates the high-to-low price range.
    Left horizontal tick shows open price.
    Right horizontal tick shows closing price.
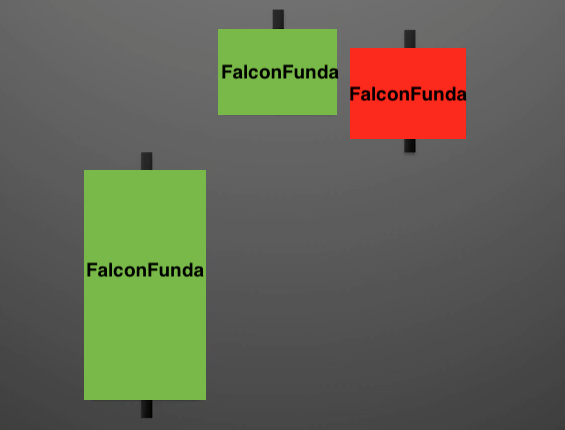
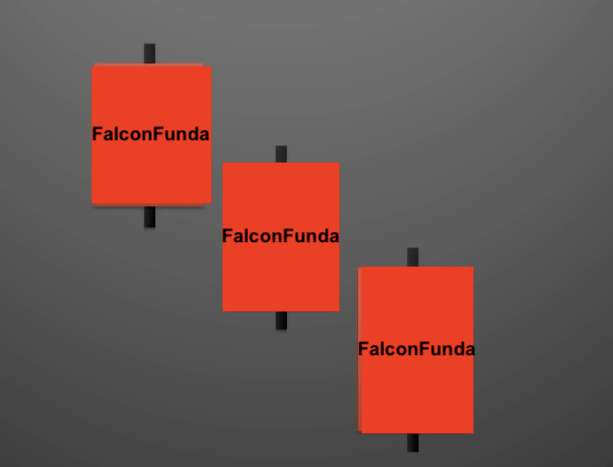
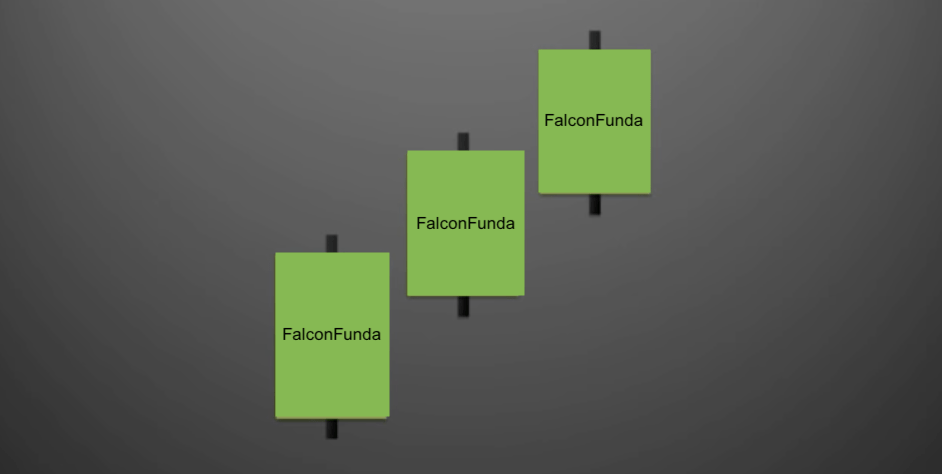
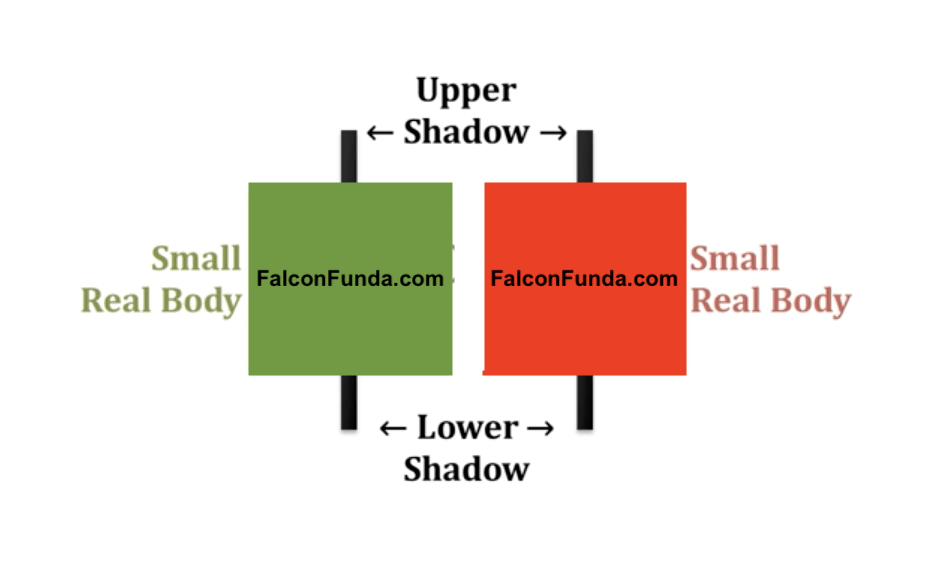
Bar charts help a trader/investor  visualise bullish sentiment ( upward / uptrend  price movement on chart ) or bearish sentiment( downward / downtrend  price movement on chart ) by displaying bars using different colours.

Bar Chart -4

A bullish bar is one in which the price has closed higher than it opened  – the vertical line of such bar is usually represented in green.

Bar Chart -3

A bearish bar  is one in which price has opened lower than it opened  –  the vertical line such a bar is usually represented in red.

Bar Chart -Example

Difference between high price and low price is called range.

Practice Bar Chart – Beginner

Practice Bar Chart – Intermediate

Practice Bar Chart – Advanced

Practice Bar Chart – Expert

How to understand your psychology of money ?

How to understand your psychology of money ?

Emotions & Sentiments drive financial markets. So it is absolutely important for you as a traders/investor to understand your own thought patterns about money. This will help you to get a grip on your emotions & make better financial investment decisions.

Understanding your money related emotions i.e fears, greed, shame, envy and coming up with a way to manage them is a must have tool for a financial investor & trader in the longer term.

People usually fall into one of the below 7 personality types according to Ken Honda, author of bestselling book “Happy Money: The Japanese Art of Making Peace With Your Money”.

  1. The Compulsive Saver
  2. The Compulsive Spender
  3. The Compulsive Moneymaker
  4. The Indifferent-to-Money
  5. The Saver-Splurger
  6. The Gambler
  7.  The Warrior

So which personality type are you ? 

Take FalconFunda’s Mindset about Moneytest and find out your personality type.

Understand Your Mindset about Money ?


Chart Patterns

Chart Patterns

Chart pattern is a shape drawn on the price chart to predict future price movements based on the past data. 
Chart patterns are split into below three types, depending on the price behaviour.
1 Reversal Chart Patterns: They signal the ongoing trend is about to change and price will reverse direction.
2 Continuation Chart Patterns:  They signal that ongoing trend will continue and price will continue in current direction 
3 Bilateral Chart Patterns: They signal that the ongoing trend will either continue or it can change direction. 

Examples of Chart pattern types.

Continuation Patterns Examples : 

  • Flag, Pennant
  • Rectangle
  • Price Channel
  • Measured Move – Bullish
  • Measured Move – Bearish
  • Cup with Handle

Reversal Patterns Examples : 

  • Double Top Reversal
  • Double Bottom Reversal
  • Head and Shoulders Top
  • Head and Shoulders Bottom
  • Falling Wedge
  • Rising Wedge
  • Rounding Bottom
  • Triple Top Reversal
  • Triple Bottom Reversal
  • Bump and Run Reversal

Bilateral patterns Examples : 

  • Ascending Triangle
  • Descending Triangle
  • Symmetrical Triangle

Traders & Investors chart patterns as a technical analysis tool to determine the projected price of securities. 

Practice Chart Patterns – Beginner


Trading Indicators

Trading Indicators

Traders use Trading Indicator as technical analysis tool on price charts to ascertain market conditions. 
There are mainly two types of trading indicators

  • Leading Indicator
  • Lagging Indicator

When applied on a price chart of a security, Lagging indicators will analyse the past market condition and indicate momentum whereas Lagging Indicators will predict future price action of a security. 

There are 100’s of trading indicators to choose from. Some of the very popular one’s are below : 

Moving Average
 Exponential Moving Average
Moving Average Convergence Divergence (MACD) 
Relative Strength Index (RSI) 
Percentage Price Oscillator (PPO) 
Parabolic SAR
Average directional index
Stochastic oscillator
Standard deviation
Bollinger bands 
Fibonacci retracement 
Williams Percent Range (%R) 
Commodity Channel Index (CCI) 
Ichimoku cloud 
On-Balance volume (OBV)
Accumulation/Distribution line
Aroon indicator

Indicators drawn on top of existing chart are called Overlays and one’s drawn separately are oscillators.

Trading Indicators – Beginner

Stock Market

Stock Market

Stock market is a place where public companies list their shares for buyers and sellers to trade.Trading happens in exchange via stock broker and electronic trading platforms.Stock market can be imagined as a collection of Stock exchanges. 
Trading in the stock market means securities are transferred from seller to a buyer. 

How does it work ? 
For example, 

  • A Company lists shares on an exchange( which becomes Guarantor ).This process is called an IP ( Initial Public offering ).
  • Buyers of this stock ( Long term Investors, Short-term Traders and others )  discover this company
  • A buyer ask specific price for a stock – This is Bid price 
  • A  potential seller asks a specific price for the same stock  – This is the ask price.
  • When bid and ask prices match, stock exchange facilitates buy and sell transactions.  If there are multiple buyers and multiple sellers  at a given price a sale happens on a first come first-served basis.

Exchanges provide real time pricing information of these listed company shares (also referred to as stock or equity ) for buyers and sellers to make a decision. Buyers and Sellers  interact with exchanges via stock brokers and electronic trading platforms.
Examples of Stock Market exchanges: NYSE,NASDAQ.
Examples of Stock brokers :  eToro,Fidelity, Robinhood, Fidelity, Trade Station.Examples of Electronic Trading Platforms :  E-Trade, Nasdaq. 

Practice- Beginner


Windows

Windows

Window is a two day potential trend continuation pattern. Window  is a gap between two or multiple day candlesticks on the price chart of a security.
A window pattern happens where there is a gap between the high price of Day1 and low price of Day2. 


A window with necessary confirmation during an uptrend of a security indicates that prices might move higher.Window usually acts as a support area.
For Downtrend, there will be a gap between the closing price of Day1 and the high price of Day 2. Window might indicate that prices will move lower and the window acts as a resistance area.

Psychology of Window pattern is that the gap/window on the chart  is an area where no trading ( i.e buying / selling of the security ) took place. So it is considered as a continuation pattern pointing to the existing trend. 

As like any other, piercing patterns require confirmation candlesticks in the following days. On a price chart of the security,  if the window appears after an uptrend and prices subsequently close below the window and then continue downward then the pattern is voided and vice-versa if it happens during downtrend.      


Practice Windows – Beginner


Tasuki

Tasuki

The Upside-Gap & Downside-Gap Tasuki Pattern are three-day trend continuation pattern(s). The Upside-gap Tasuki is a bullish continuation pattern and Downside-gap Tasuki is a bearish continuation pattern.

Upside-Gap Tasuki happens during an uptrend. Day1 is a bullish candlestick. Day2 is a smaller bullish candlestick that gaps up from the previous day. Day3  is a bearish candlestick that opens within the real body of the second day and closes below the real body of the second day and fills in some of the gap.


The psychology of the Upside-Gap Tasuki pattern is that Day1 and Day2 candlesticks confirm the previous uptrend. Day3 close price bearish candlestick leaves a gap that will potentially act as a support or resistance. If this is confirmed in the following days then the upward trend continues.

Downside-Gap Tasuki happens during a downtrend. Day1 is a bearish candlestick. Day2 is a smaller bearish candlestick that gaps down from the previous day. Day3  is a bullish candlestick that opens within the real body of the second day and closes above the real body of the second day and fills in some of the gaps.


The psychology of the Upside-Gap Tasuki pattern is that Day1 and Day2 candlesticks confirm the previous uptrend. Day3 close price bearish candlestick leaves a gap that will potentially act as a support or resistance. If this is confirmed in the following days then the upward trend continues.


As with any other patterns, Task patterns require confirmation candlesticks in the following days. If no confirmation then the pattern signal can be considered as voided. 


Practice Tasuki – Beginner


Tweezer

Tweezer

The Tweezer Pattern is a two day pattern indicating either a market high or market low. 
A Tweezer Top pattern has highs of the candlesticks equal and is a bearish reversal pattern.  These candlesticks can be of real bodies, shadows or dojis.
 Tweezer Top -3      Tweezer Top-1 Tweezer Top -111
A Tweezer Bottom pattern has lows of candlesticks equal and is a bullish  reversal pattern.Candlesticks can be of real bodies or shadows or doji’s. 

Tweezer Bottom -1

Tweezer Bottom-3

Tweezer Bottom


Psychology of the Tweezer pattern is that both bears or bulls are not able to push the prices further up or down and hence are considered as a trend reversal. 
Tweezer Top occurs during an uptrend. On Day1 bulls push prices higher, Then, on Day2  bears  reverse the market sentiment i.e market does not breach the prior day’s highs, and heads straight down, often eliminating most of the prior period’s gains.

Tweezer Bottom -2Tweezer Bottom  occurs during a downtrend. On Day1  bears  push prices down by pushing the price near low and then, on Day2  bulls reverse the market sentiment i.e market does not breach the prior day’s low instead  price of the security goes up, often eliminating most of the prior day’s losses for bulls.

 Tweezer Top -22

Practice Tweezer Pattern – Beginner


Upside Gap Two Crows

Upside Gap Two Crows

The Upside Gap Two crows is a three candlestick  trend reversal pattern. 
This pattern occurs after an uptrend.Day1 has a longer bullish  candlestick. Second day candlestick is a gapped up bearish candlestick and the real body should be above the real body of the first day’s candlestick. Day3 candlestick is a bearish candlestick that gaps up from the Day2 candlestick and closes below the close Day2 candlestick. Day3 candlestick basically engulfs the real body of Day2 real body. 

Upside Gap Two Crows-1
  
Psychology of Piercing pattern is that on day one bullish candlestick  confirms the previous uptrend. On Day2 the price of the security gaps up to indicate bulls  are dominating  but instead the price of the security closes bearish but still higher than the Day1 closing price. On Day3  bulls attempt to take the prices again with the gap up but the bears take control and  push the price of the security down  below the real body of Day2.  As bears are able to push the prices down in two successive days, this indicates the price of the security can be expected to go down or move sideways. 

 Upside Gap Two Crows-3 Upside Gap Two Crows-2


As like any other, Upside Gap two crows  require confirmation candlesticks in the following days. If future day candlesticks go above  the Day3 candlestick  then the pattern is voided. 

Practice Upside Gap Two Crows – Beginner


Three Black Crows

Three Black Crows

TheThree black crows is a three day trend reversal pattern. 
This  happens after a uptrend and it has all bearish candlesticks which close near the lower price of that particular day. The open price of each of the candlestick should be with in the real body of the previous day’s candlestick

Three Black Crows Pattern -1 

Psychology of Three black crows  pattern is that during uptrend  one large bodied bearish candlestick on Day 1 indicates  that bears managed to keep the price of the security at low. This is repeated on Day 2 and Day 3. As Open, High, Low and close of these bearish  candlesticks are lower than the previous day’s candlesticks, it indicates the strength of bearish  momentum and signals that prices are moving down. 

Three Black Crows Psychology

Three Black Crows – Beginner

Three Black Crows – Intermediate

Three Black Crows – Advanced

Three White Soldiers

Three White Soldiers

Three white soldiers is a three day trend reversal pattern. 
This  pattern happens after a downtrend. It consists of three large bullish candlesticks with each of them closing higher than the previous one. Each of these candlesticks should open within the body of the previous one. The upper wicks should be very small or non-existing 

Psychology of Three white soldierspattern is that  during downtrend one large bodied bullish candlestick on Day 1 indicates  that bulls managed to keep the price of the security at high which indicates strength. This is repeated on Day 2 and Day 3. As Open, High, Low and close of these bullish candlesticks are higher than the previous days candlesticks, it indicates the strength of bullish momentum and signals that prices are moving up. 

Three White Soldiers -1


Practice Three White Soldiers – Beginner

Practice Three White Soldiers – Intermediate

Practice Three White Soldiers – Advanced

Spinning Top

Spinning Top

The spinning top is a single day candlestick pattern.

A spinning top has a small real body i.e no difference between the open and close price of the security.  It shows that neither bulls nor the bears are in control. Multiple spinning tops may be a signal for upcoming trend reversal. 

Spinning Top at Bottom

Spinning Top at the Top


The psychology of Spinning top is that on the day of the spinning top the bulls sent the price higher and bears then sent the price lower which results in the asset price closing near where it opened. For security, If multiple days spinning top candlesticks are occurring after the previous uptrend then it might be a sign of consolidation and upcoming downtrend and vice-versa.

Spinning Top - Pyschology

High wave candlesticks are spinning tops with long upper and lower shadows.

High Wave Candle

Practice Spinning Top – Beginner

Practice Spinning Top – Intermediate

Practice Spinning Top – Advanced

Practice Spinning Top – Expert