Inflation,
Interest rate rise,
Global market chaos,
Upcoming recession in 2022 ….?
As a financial trader/ investor, do you understand how the economy works? – Learn from legendary investor Ray Dalio by watching this video!

We launched AI learning feature.

Inflation,
Interest rate rise,
Global market chaos,
Upcoming recession in 2022 ….?
As a financial trader/ investor, do you understand how the economy works? – Learn from legendary investor Ray Dalio by watching this video!
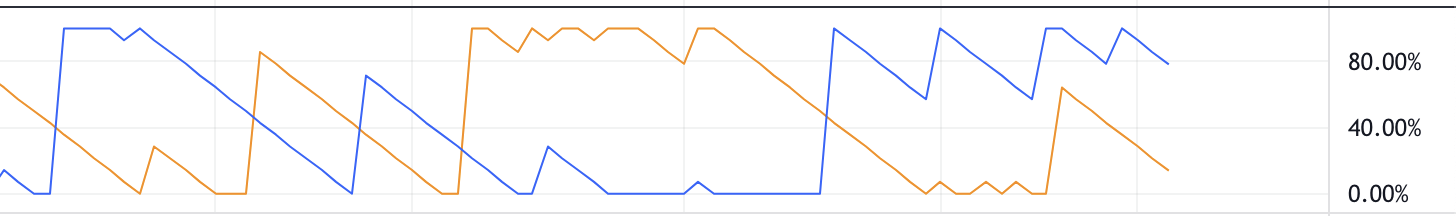
Aroon Indicator is a chart underlay indicator used by traders /investors to identify the trends and also their strengths.
Aroon Indicator is a useful tool for traders and investors who want to identify trends and their strengths. It’s available under indicators on charting tools like TradingView, and it has two parts:
AroonUp and AroonDown.
Both AroonUp and AroonDown range between 0 and 100 and values are calculated using the below formulas for an n-day period.

Image: Aroon Indicator applied onto TradingView chart!
Both AroonUp and AroonDown range between 0 and 100 and values are calculated using the below formulas for an n-day period.
Aroon-Up = [(n-Days – Periods Since the Highest High within Period Specified) / n-Days] x 100
Aroon-Down = [(n-Days – Periods Since the Lowest Low for Period Specified) / n-Days] x 100
When applied to the price chart, Aroon Indicator represents a range-bound trend for a given period. A strong trend is indicated when Aroon line is close to or around 100, while a weaker trend is indicated when it’s close to or around 0. If it’s close to or around 50, then it’s a ranging trend.
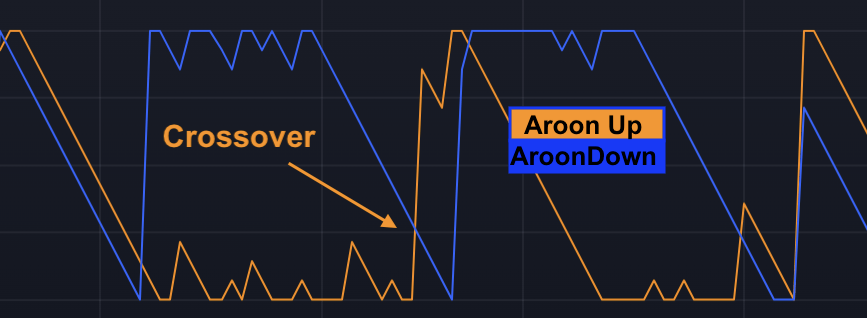
Image:Aroon Crossover
To look for trends and signals using Aroon Indicator on charts, traders usually look for new trends if Aroon Up/Down lines cross each other. For example, if Aroon-Up crosses above and the Aroon-Down cross each other and continue in opposite directions with one line going above 50 and the other line below 50, then upward-moving, traders usually expect a new trend to begin.
Table showing Aroon lines Vs Up/ Downtrend :
| Trend Vs Aroon Lines | Aroonup | Aroondown |
| Uptrend | >50 and close to 100 | < 50 |
| Downtrend | < 50 | > 50 and close to 100 |
Practice Aroon Indicator – Beginner
Practice Aroon Indicator – Intermediate
Next Read: TradingView Screeners
Follow the below steps to capture an image of your TradingView Chart.
1) Open your TradingView chart.
2) On the top right-hand side, you will see a ‘Take a Snapshot‘ camera like icon – it is just beside Publish button.
3) Click on this camera like icon.
4) You will see below five options.
Follow the below steps to capture an image of your TradingView Chart
TradingView Tips – Take a Snapshot Icon click Options
5) Choose one of the above options to get the image of your chart.
Pro Tip: Press Alt Cmd S (Mac ) or Alt Cmd S(Windows) on your keyboard to save the chart image.
Next TradingView Tip to read – How to add a text note to your TradingView chart symbol?

As a beginner, are you debating how much money to allocate for trading?
You can use FalconFunda’s below 4D’’s approach to determine your budget.
Following these steps will give clarity on your financial situation and have a sense of control instead of throwing money into the financial markets and putting yourself at risk of getting into financial trouble!
Step1 : (D)etermine your personal finances for the next 6 months.
Step 2: (D)etermine your Savings money.
Step 3: (D)etermine money you have and don’t need to use for the next 6 months.
Step 4: (D)etermine your risk appetite by putting together a trading plan.
Your trading budget should be 20-30% of the money you don’t need to use for the next 6 months!
Download Google sheet which will auto-calculate your trading budget.
Download the Budget Calculator
Read next: You need zero money to start trading /investing as a beginner!

Have you ever looked at a chart and wondered, “Should I buy or sell?”
Have you ever wanted to learn trading — not from a textbook, but from real charts in real market conditions?
Now’s your chance.
FinTorro, the free learning app designed for beginner traders, has partnered with global broker Star Trader to bring you something truly unique:
A guided, interactive challenge where your decisions matter, your confidence grows, and your knowledge compounds.
Welcome to the 30 Day Forex Quest — a hands-on trading journey like no other.
This is not a simulation. This is not a demo contest.
The 30 Day Forex Quest is a risk-free, chart-based learning experience that mimics real-world trading — one day at a time.
For 30 consecutive days, you’ll receive a new trading chart. Your task is simple: Decide — Buy, Sell, Hold, or No Trade.
Each decision earns you coins based on:
Accuracy: Was your call correct based on what happened next?
Consistency: Did you build a winning streak?
Correct Decision: +10 coins
Streak Bonus (3 or more in a row): +5 coins
Wrong Decision: 0 coins
Your goal: make smart decisions every day, learn fast, and climb the leaderboard.
At the end of the challenge, the top participants will unlock incredible prizes:
1st Place: £500 funded trading account from Star Trader
2nd Place: 1-Year Access to FinTorro Pro, with advanced AI learning features
3rd Place: 3-Month Pro Access + Exclusive FinTorro Trader Merch
Zero trading risk — no real trades, no real losses
Hands-on learning — perfect for beginners ready to level up
One chart a day — fits your routine, builds your discipline
AI-powered feedback — after each decision, learn what worked and why
Daily progress tracking — see your growth on the leaderboard
Whether you’re just starting out or want to sharpen your instincts, this challenge is built to make you better — one chart at a time.
You can enter the challenge via:
The FinTorro App (iOS & Android)
No previous trading experience required.
To learn more about trading with our partner broker, visit:
Star Trader is a trusted, global multi-asset broker offering access to forex, commodities, indices, cryptocurrencies, and more. With fast execution, competitive spreads, and cutting-edge platforms, Star Trader empowers traders of all levels to participate in today’s dynamic financial markets.
Stay connected with Star Trader on:
The 30 Day Forex Quest isn’t just a challenge — it’s a mindset.
It’s a journey where you train your trading muscles, think critically, and earn real-world insights without putting a single penny at risk.
You’ll walk away sharper, more confident, and better prepared for live trading.
Start your quest today at www.blog.fintorro.com/startrader

Zero!
You don’t need real money!
Use the below approaches to start your trading journey before using real money.
1 Use Demo account:
Exchanges, brokers usually allow traders to set up demo accounts to start trading in Stocks,
Forex, Commodities, Crypto, ETFs, Currencies, Indices, You will be given virtual money to start experimenting!
2 Use TradingView Paper Trading:
TradingView charting tool has a paper trading feature that you can use to practise your trading skills as a beginner. You will be given 100000 USD fake money.
3 Use Learning to Earn
Crypto exchanges like Coinbase pay you in crypto for watching educational content. Learn to regularly accumulate crypto and use it to participate in crypto trading markets.
Before you think of putting in real money, use all the above approaches to do at least 50 trades and document your profit /loss and strategies for each of these trades in a journal.
This will help you refine your trading plan based on your trades with fake money first and then you can start trading with real money!
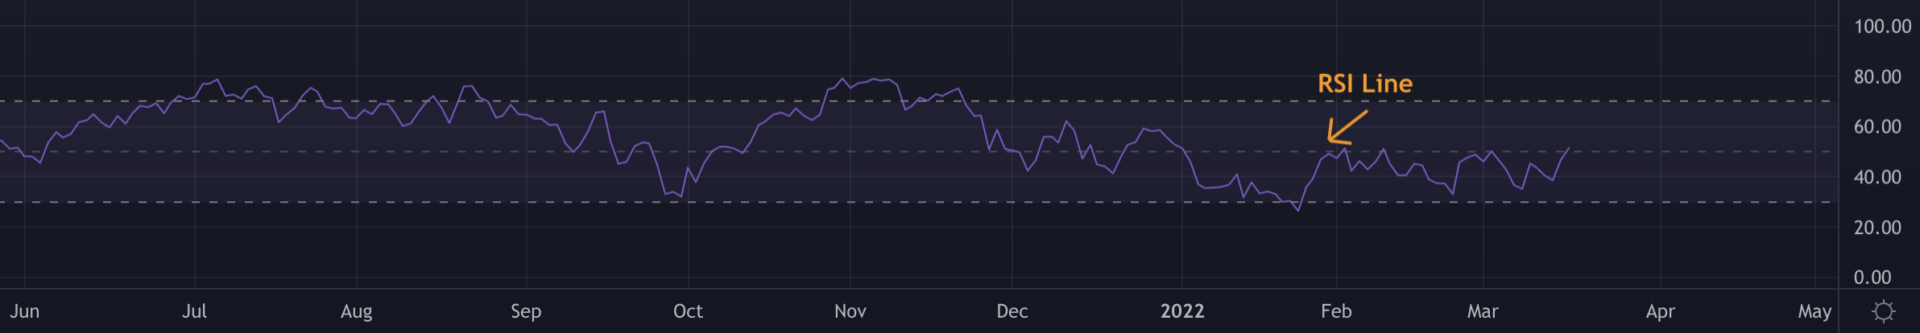
Relative Strength Index (RSI )is a technical analysis momentum indicator used by traders /investors to identify extent of price movements and general trend in financial securities.

A Tradingview chart with RSI Indicator applied!
The RSI indicator on the price chart usually has a single line (RSI line).
RSI value ranges between 0 and 100 at any given point of time and these are calculated in two steps using average price gains and losses over a default 14 day time period.
How to interpret RSI ?
If RSI value > 70 then the security is considered overbought and oversold if RSI < 30.
How to confirm trends using RSI ?
Security’s price is considered to be in uptrend if its RSI value is between 40-90 and downtrends if it is ranging between 10-60.
How to derive Trading signals from RSI Indicator ?
Traders derive RSI signals based on RSI values, divergence and also Bullish / Bearish swing rejection.
Divergence happens when there is a difference between the RSI line and the price action of the security.This is considered as a very strong signal.
Sentiment Vs RSI value mapping
| Bullish signal | The RSI line is crossing below or hovering around the 30-40 RSI range. |
| Bearish signal | The RSI line is crossing above 70 or hovering around the 70-90 range. |
Sentiment Vs Divergence mapping
| Bullish signal | Price of the security makes lower lows and RSI makes higher lows. |
| Bearish signal | Price of the security makes higher lows and RSI makes lower lows |

By failing to prepare, you are preparing to fail.” – Benjamin Franklin
Trading/Investing is a professional activity. It involves making decisions regularly. The trading plan will act as a reference document for a trader to make these decisions.
You can use FalconFunda’s below 3D approach to put together your trading plan.
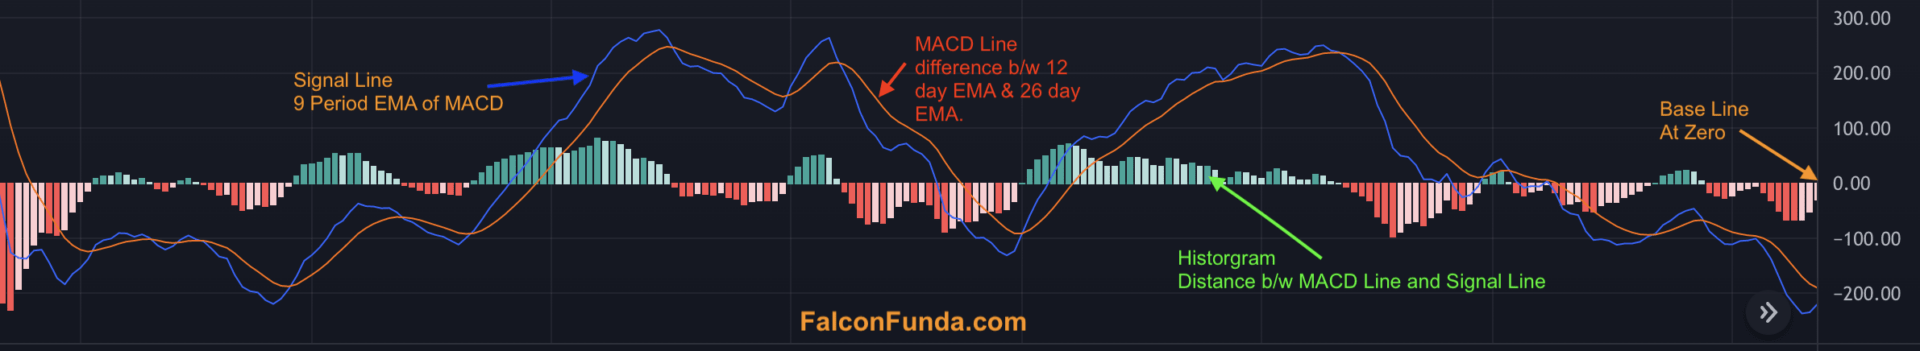
Moving Average Convergence Divergence (MACD) is a technical analysis momentum indicator used by traders /investors to identify the trend direction of securities.

The MACD indicator on the price chart usually has below parts:
Some key things to remember:
How to derive Trading sentiments from MACD?
Traders derive trading signals based on when MACD and Signal lines crossover, diverge, fall/ rise.
Sentiment Vs Crossover Mapping
| Bullish Sentiment |
|
| Bearish Sentiment |
|
Sentiment Vs Divergence Mapping
Divergence happens when there is a difference between the MACD and the price action of the security on the chart. This is considered a very strong signal.
| Bullish Sentiment | Price of the security makes lower lows and MACD line makes higher lows. |
| Bearish Sentiment | Price of the security makes higher lows and MACD line makes lower lows |

Your attitudes and beliefs play an important role in your trading / investing journey. You can use FalconFunda’s below 3T’s approach to continuously (re)-build yourself.
(T)une your Mindset:
Financial markets are constantly changing and you have to tune your mindset to be ‘positive’ on an everyday basis to adapt to situations, keep your emotions under control and make better decisions.
A key question to ask yourself daily which will help to tune your trading/ investing mindset is ‘ What can I learn from this situation? ‘.
(T)une your Motivation:
Let’s accept it, our motivation levels fade over time. So how do you tune your motivation levels even when you don’t feel like it?
One of the most important things you can do at the beginning of your trading / investing journey is to document your ‘why’ and also goals.
So ask yourself every day ‘What is my reason for trading / investing? ’ to help tune your motivation levels !!
(T)une your Habits:
Like anything else, you need to identify and practise good habits on an everyday basis to be successful in your trading & investing journey.
Some of the key everyday habits for a trader are
So ask yourself every day ‘Have I practised the right habits today to achieve my investing & trading goals?’.
Falconfunda.com can help you learn trading fundamentals via email every day!
Finally, have & show gratitude no matter what!!
Download Excel Sheet – Tuning Log
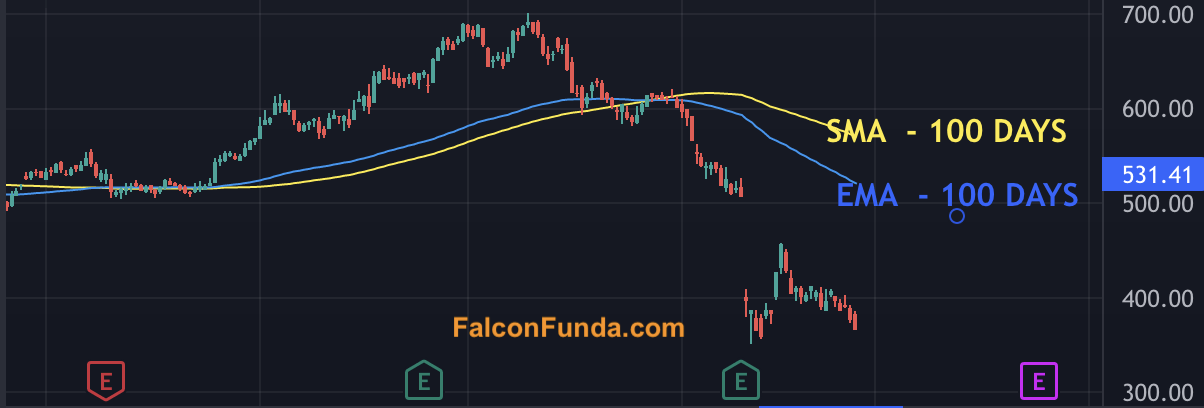
Exponential moving average (EMA ) is a technical analysis indicator used by traders /investors to identify upward or downward trend direction of securities.
Unlike SMA, EMA gives more importance to data that is more recent. Because of this EMA follows prices on the chart more closely than a SMA.
Psychology of Exponential moving average indicator is that it helps a trader understand the general direction of the trend. A rising EMA line on the chart will support the price move encouraging traders to participate and falling EMA line on the chart will provide resistance to the price move means traders will be lenient to sell.
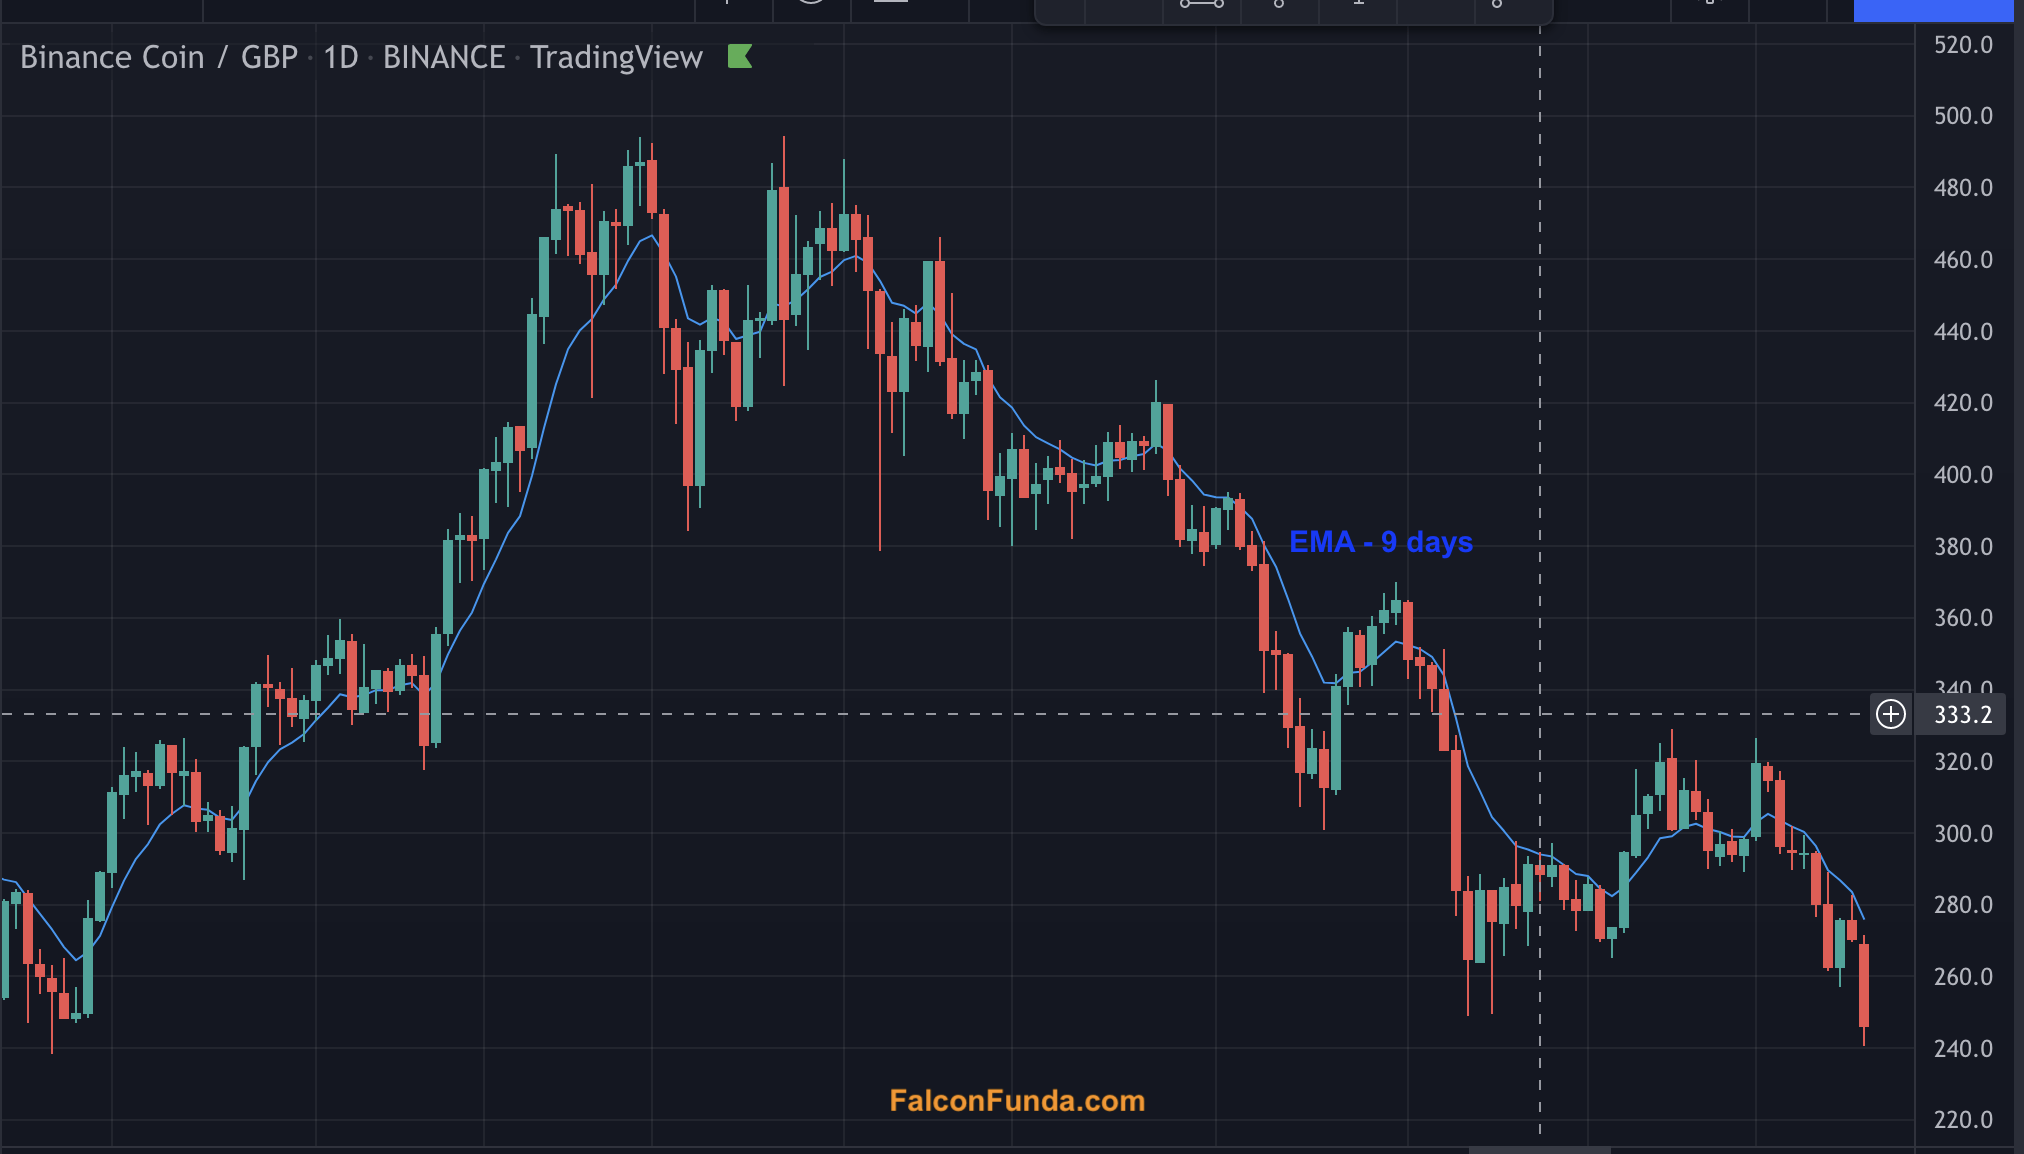
Exponential moving average is available as an indicator on charting tools like TradingView.On the price chart,d irection of the EMA line will indicate whether the security is in uptrend, downtrend or ranging.
Traders/Investors simply apply this EMA indicator to a chart and derive trend direction.
After applying the Exponential moving average indicator, if the EMA line is moving down consistently then it indicates downtrend and vice-versa.
Practice Exponential Moving Average – Beginner
Practice Exponential Moving Average – Intermediate
Exponential Moving Average is a very popular indicator for doing technical analysis!
Follow these instructions to apply Exponential Moving Average Indicator onto any chart on TradingView!
Step 1: Have your tradingview chart open.

Step 2: Click on Indicators & Strategies icon on the top.

Step3 : Type ‘Moving into the search box on the top of the the popup window’. Select Moving Average Exponential. Click X icon on the Top right hand side.

Step4 : Observe the EMA line on the chart

Step 5 : Adjust the EMA line color, Moving Average length, color and other values by ‘double clicking on the line’!
Next : Learn how to interpret signals using Exponential Moving Average – Technical anlaysis indicator on chart!