Fintorro is a company dedicated to educating people about investing and trading in financial markets through bitesize courses for free for a lifetime. London Trader Show will return in 2025. In 2024, London Trader Show happened on March 8th and November 1st 2024.
Introduction
As an exhibitor, we were thrilled to be a part of such an important event.
This magazine article provides an overview of Fintorro’s experience at the London Trader Show, including the exhibition stand, expert talks, networking opportunities, and insights gained.
Fintorro’s Exhibition Stand:
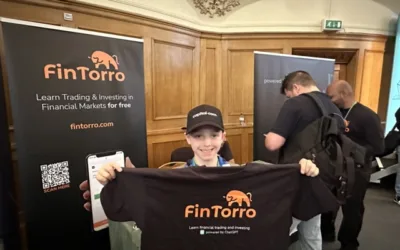
At the London Trader Show, Fintorro set up an interactive and informative exhibition stand that caught the attention of many attendees. Our team members engaged with visitors, answering their questions about our platform and services.

Image: FinTorro Exhibition Stand – London Trader Show 2023
We highlighted the bite-sized lessons and playful rewards that make learning about investing and trading fun and engaging. Also, we emphasized that all our courses are entirely free, making them accessible to anyone, regardless of their financial background.
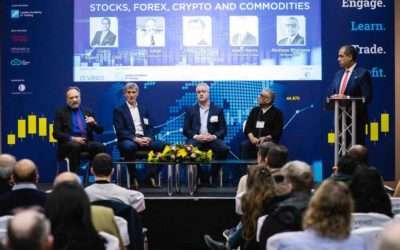
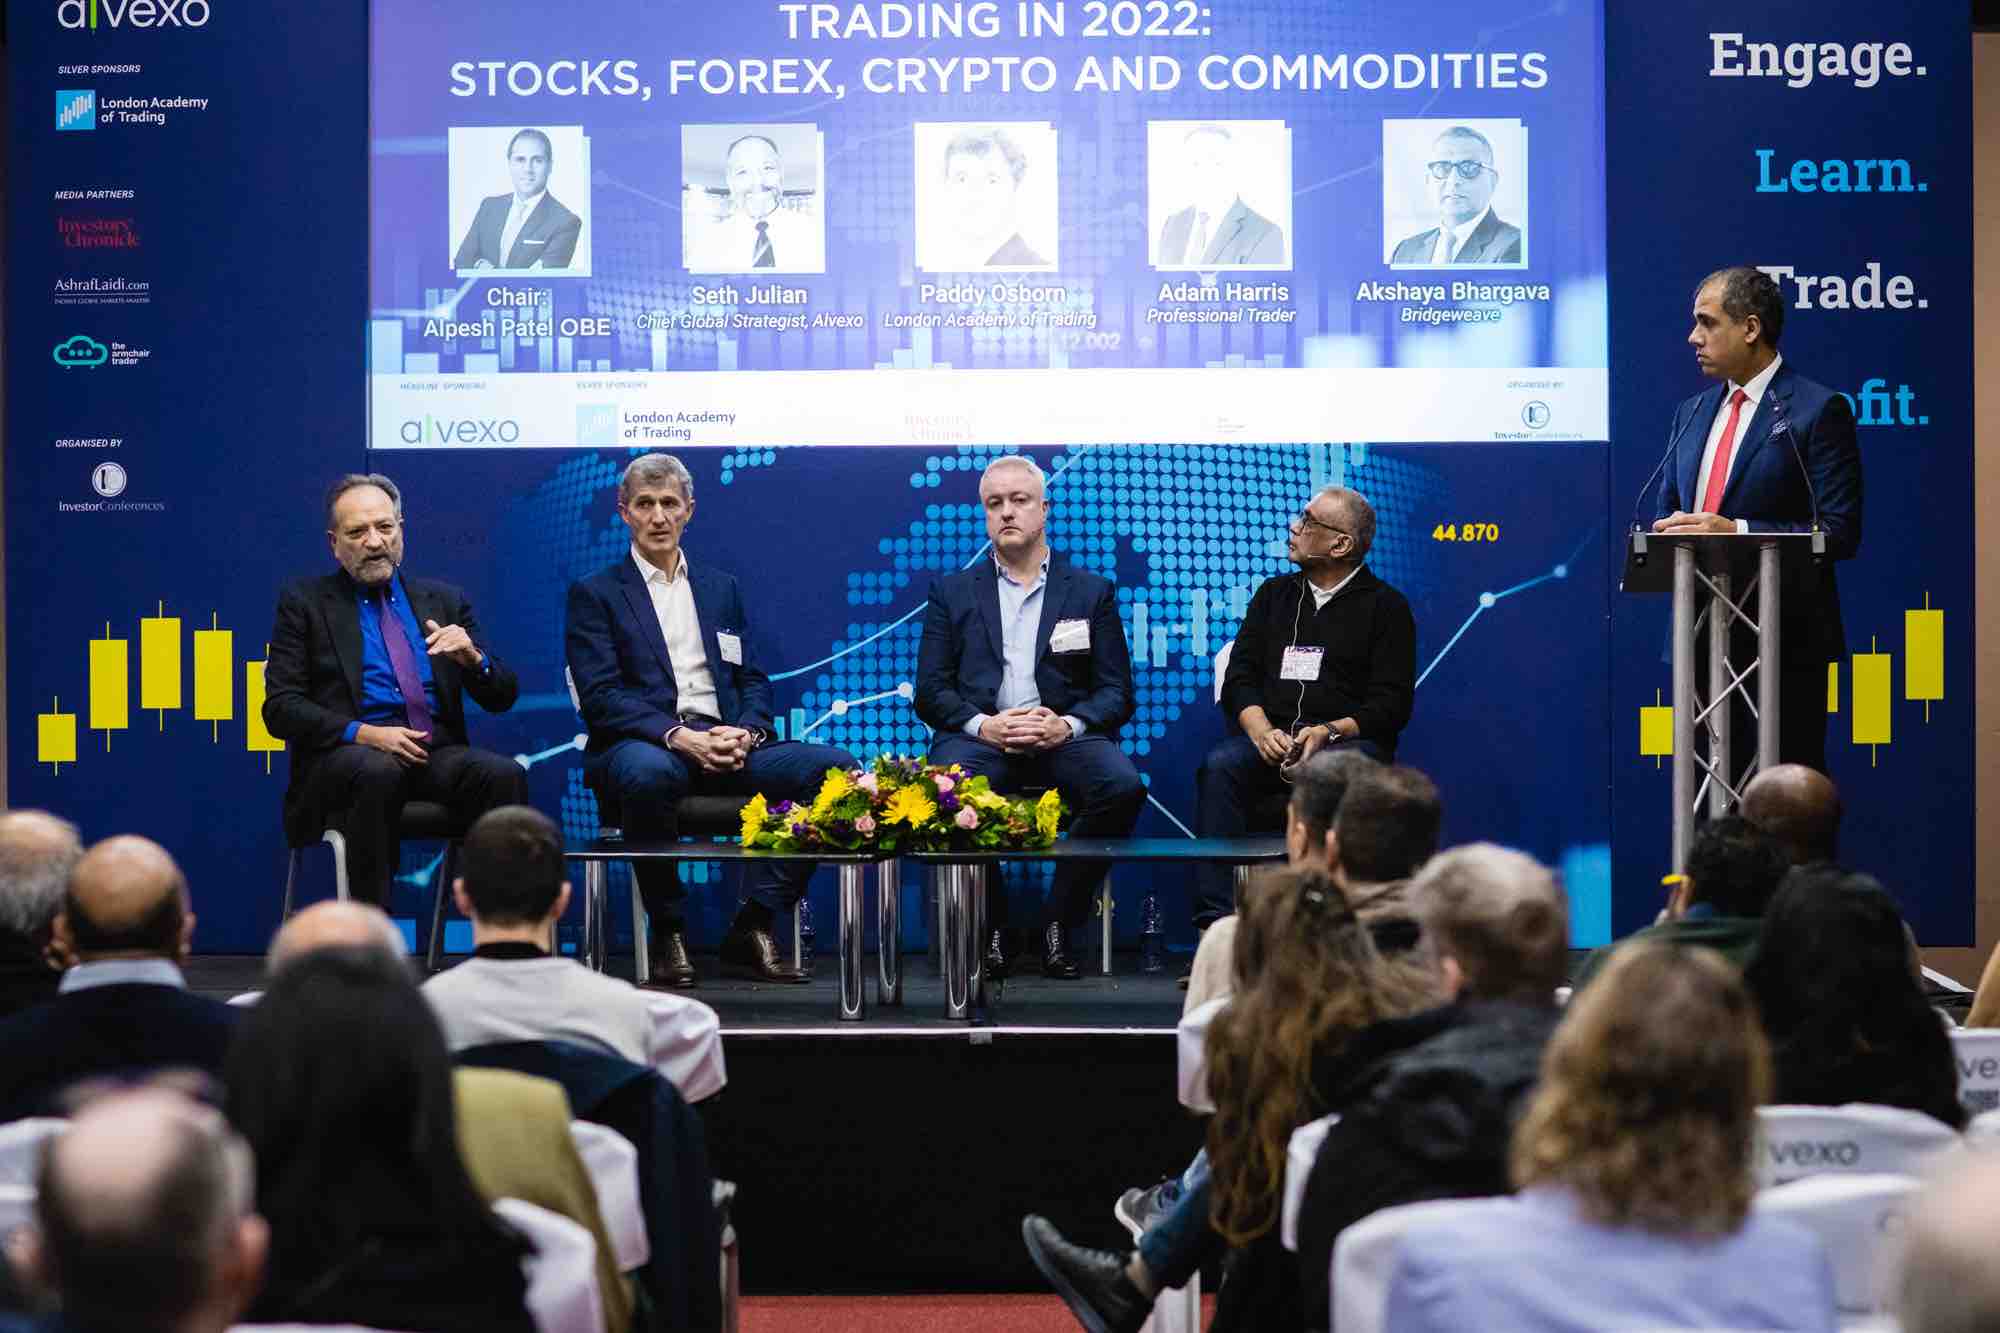
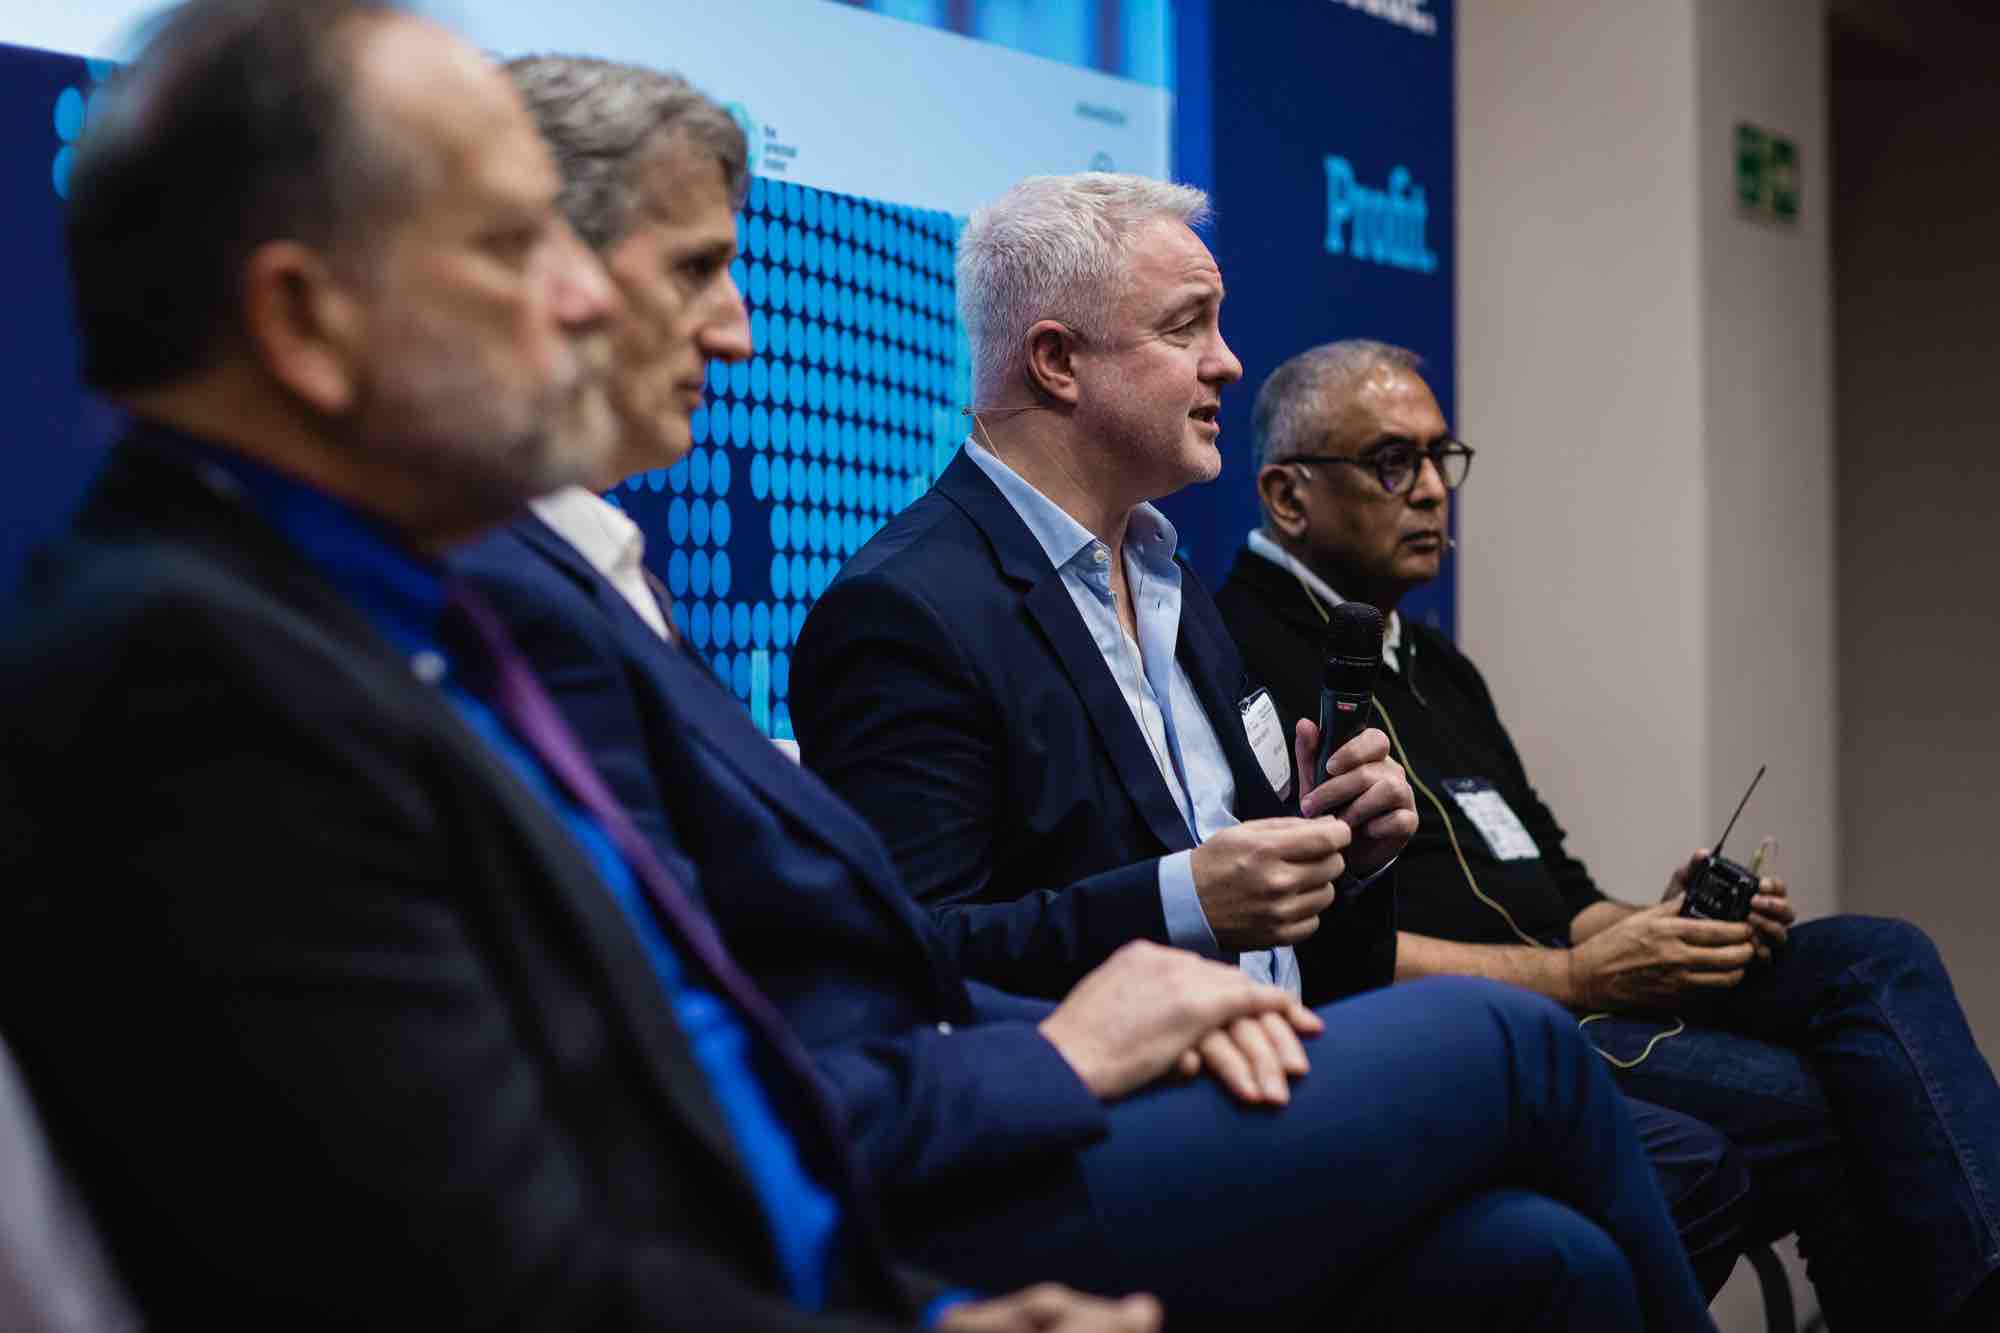
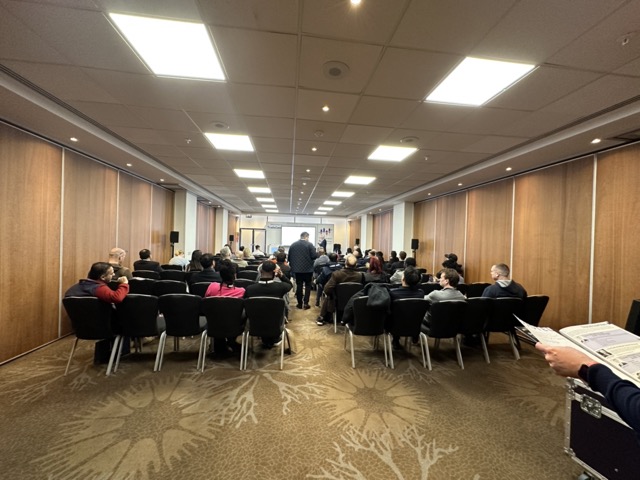 Image: London Trader Show 2023 – Expert Talks
The London Trader Show featured expert speakers and panelists who shared their insights, tips, and experiences in trading and investing. Dr. Mayen Egbe spoke about the importance of emotional intelligence and self-awareness in making rational decisions, while other experts discussed the future of digital assets, swing trading methodology, and achieving exponential growth in trading.
We attended several talks and panels, including those by Saul Lokier, Paddy Osborn, David Paul, and James North.
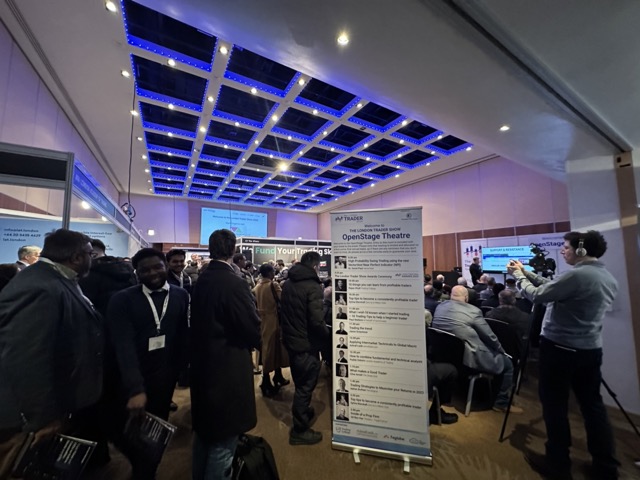
LondonTraderShow-Live Trading Demos & Exhibitors
Below are some of the other talks at the event which caught our attention:
Trade the Pool: One of the most popular talks at the London Trader Show conference was presented by Trade the Pool. Their speaker, Michael Katz, discussed the #1 reason traders fail, and how to fix it. Katz’s talk was well-attended, and attendees praised the actionable advice he provided. Trade the Pool’s exhibition stand was also a hit, with visitors eager to learn more about their proprietary trading platform.

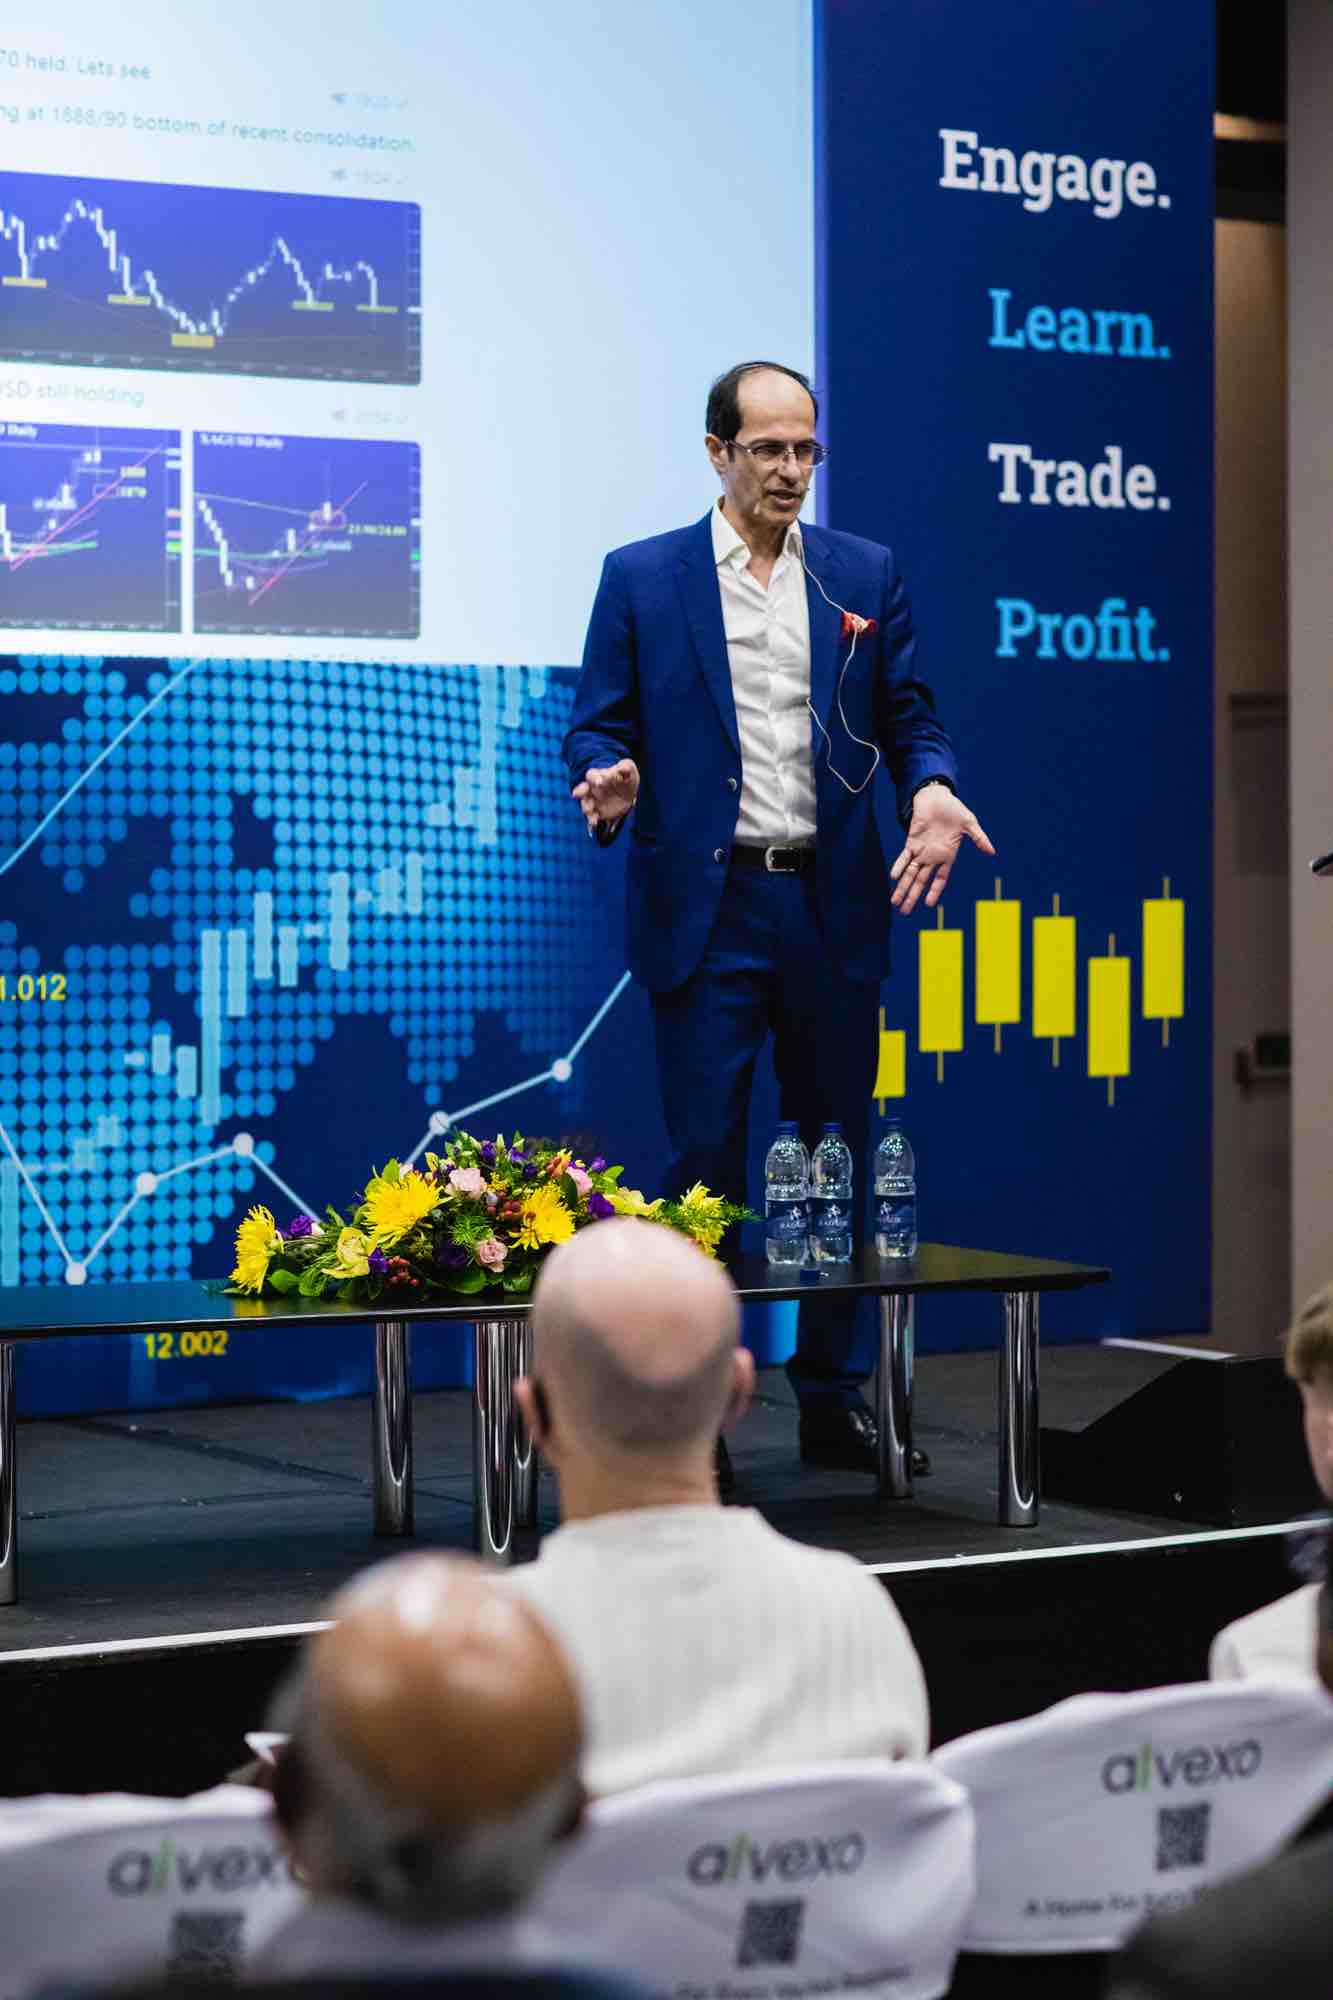
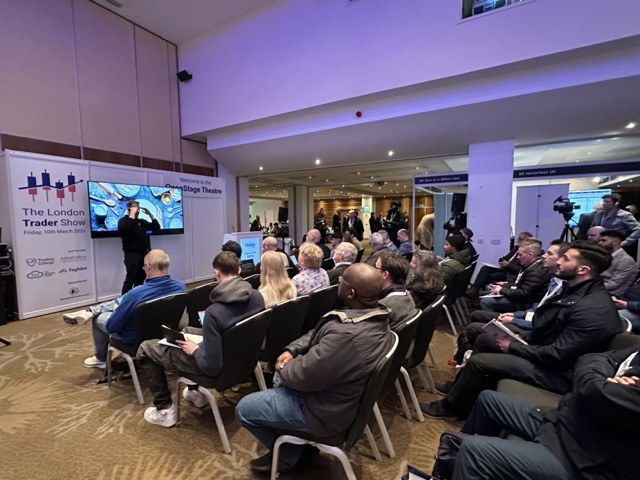
Image: London Trader Show 2023 – Expert Talks
The5ers: Another standout at the London Trader Show conference was The5ers. Their speaker, Saul Lokier, presented on how to achieve exponential growth in trading. The5ers’ exhibition stand was also a popular destination for attendees, who were impressed by the range of trading tools and resources available through the platform.

VectorVest: David Paul from VectorVest gave a talk on a simple-to-execute and high-probability swing trading methodology. His presentation was well-received, and attendees praised the practical advice he provided. VectorVest’s exhibition stand was also a highlight of the conference, with visitors eager to learn more about their trading tools and resources.
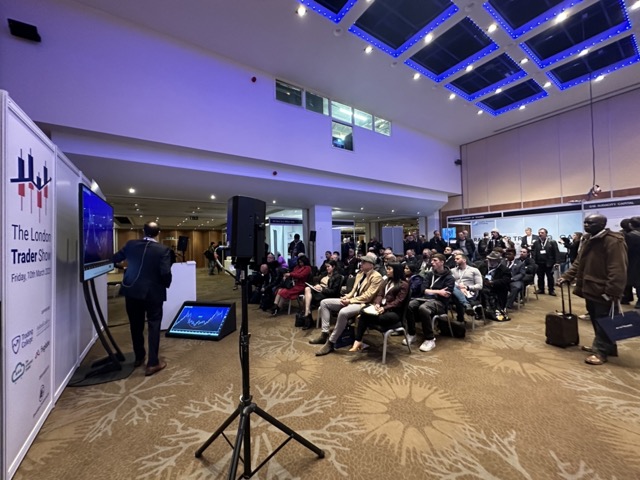
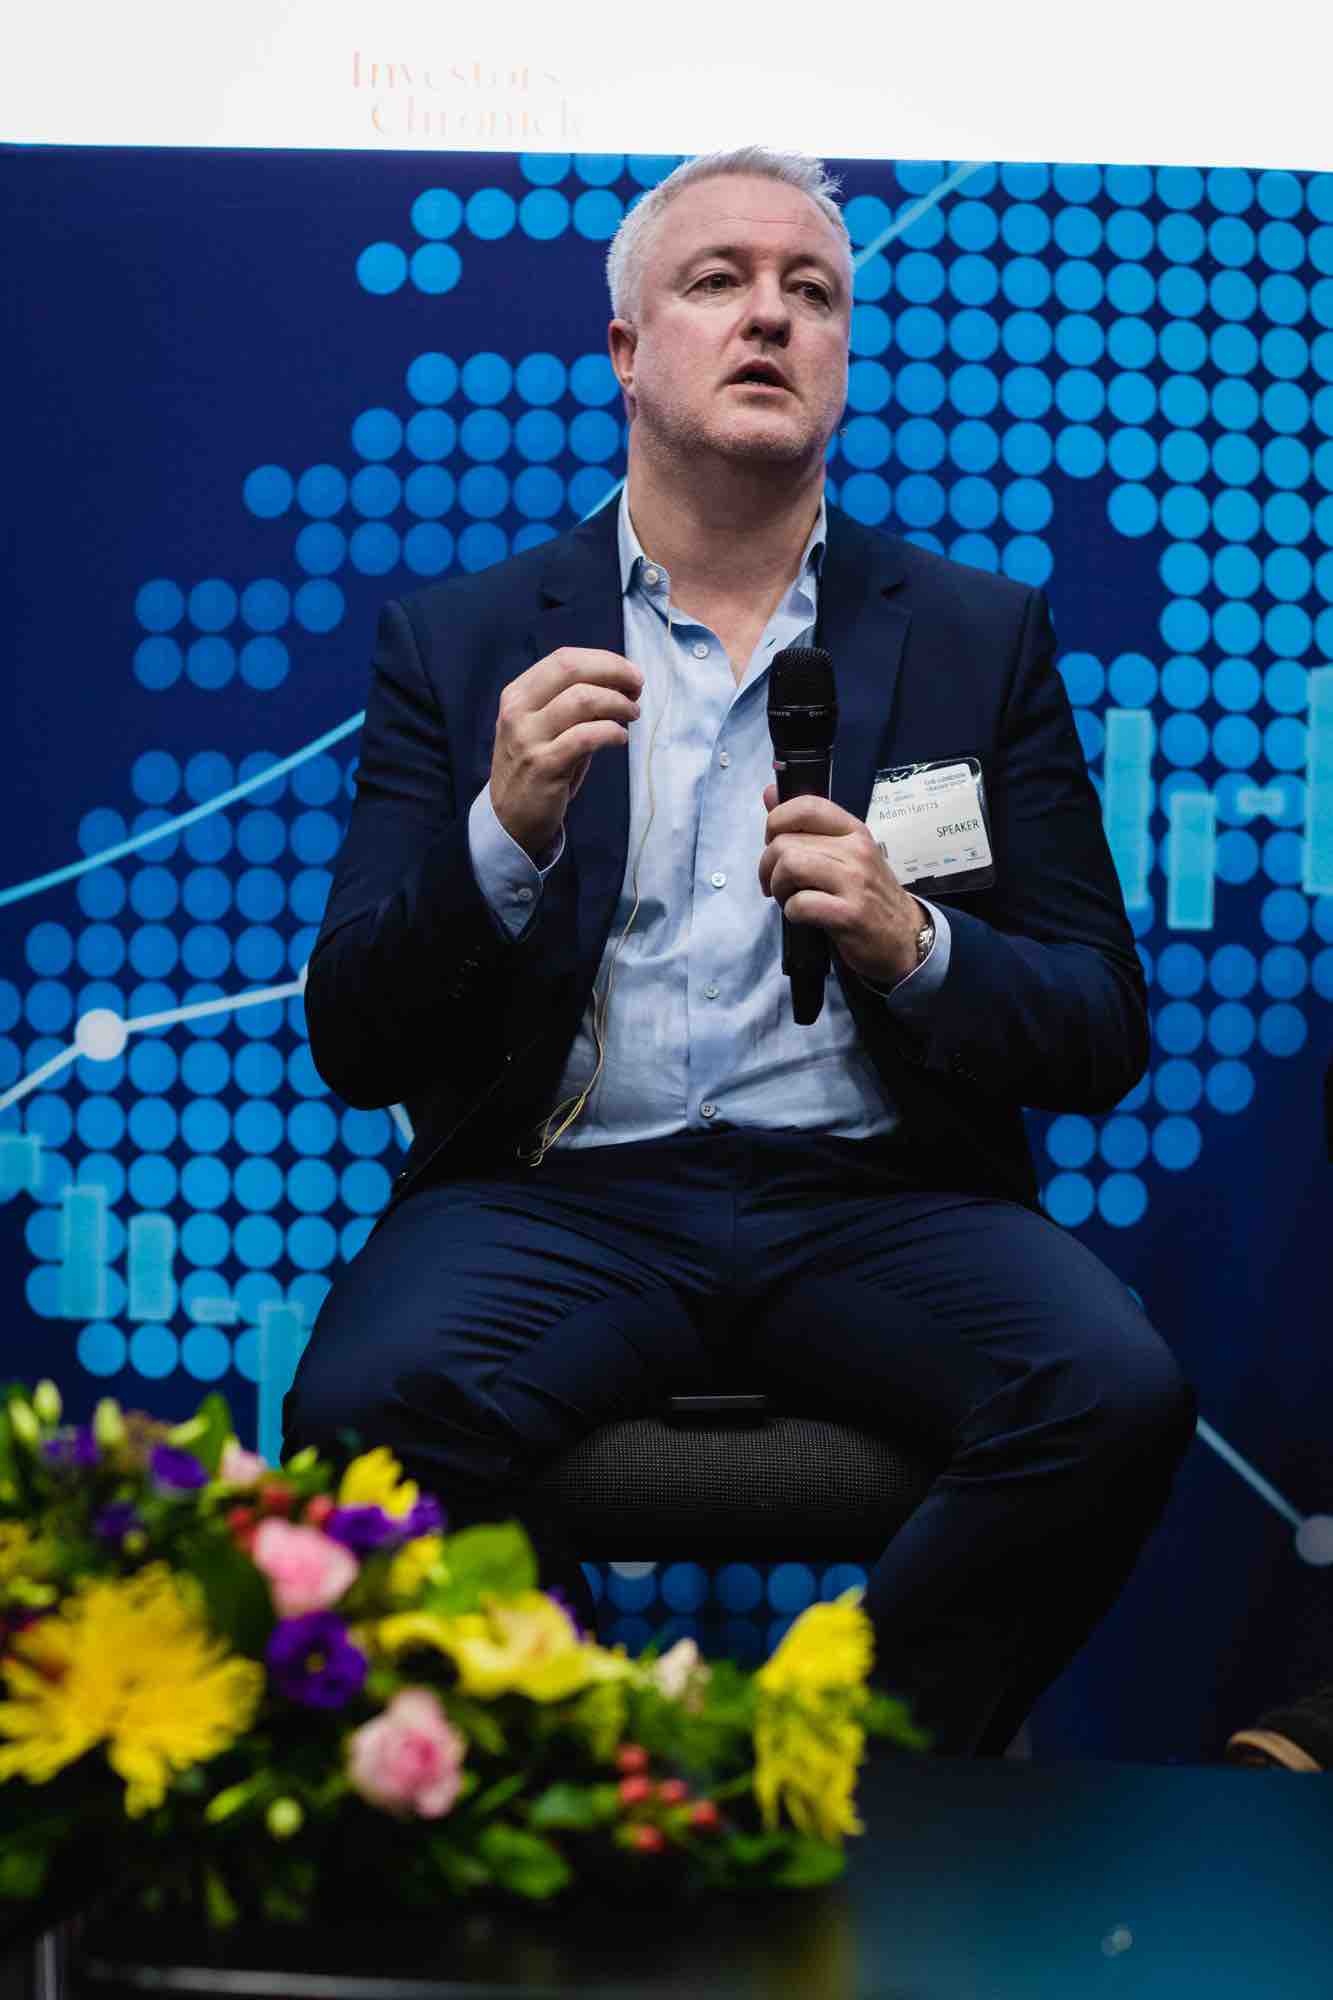
Image: London Trader Show 2023 – Expert Talks
Armchair Trader: Armchair Trader also had an exhibition stand at the conference, showcasing their trading platform and tools. Their stand offered visitors the chance to speak with Armchair Trader representatives, who provided advice and insights into how to use their platform to achieve trading success.
Live Trading Demos and Exhibitors:

Professional traders showcased their skills and strategies in real-time, and Fintorro had the chance to explore many exhibitors, including brokers, platforms, software providers, and financial institutions.
We learned about the latest technologies and innovations in the industry and made valuable contacts.
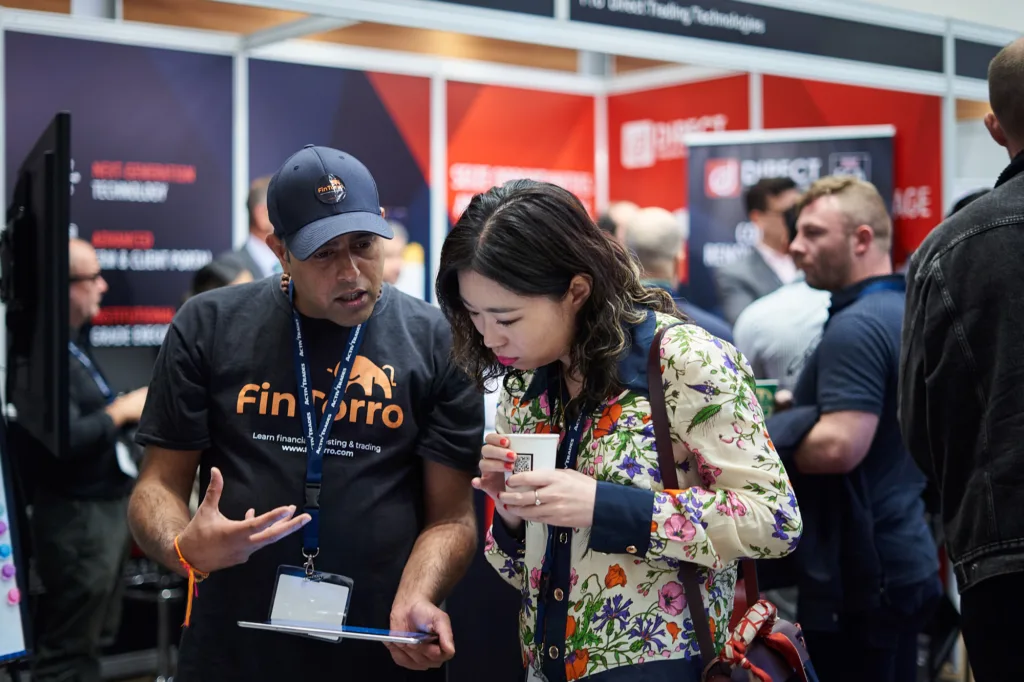
The People We Met:
At the London Trader Show, we connected with traders and investors from all over the world, impressed with their knowledge and expertise. We also had the opportunity to connect with other exhibitors and sponsors, leaders in the financial industry. It was exciting to learn about their latest products and services and hear about the ways they are helping people achieve financial success.
Insights We Gained:
Attending the London Trader Show provided us valuable insights into the latest trends and developments in the financial industry. We attended a number of seminars and workshops, covering topics such as new trading strategies, trading psychology, and how to optimize profits. Also, we heard from some of the top experts in the industry, who shared their insights and experiences with the audience.
Networking and Gaming:
Finally, we had a lot of fun networking and gaming at the London Trader Show, meeting traders and investors from all over the world, exchanging business cards, and sharing stories and insights. We also played interactive games and challenges, such as a virtual reality trading simulator and a trivia contest on trading history and trends. It was a great way to unwind and have fun while exploring the world of trading and investing.
Conclusion:
The London Trader Show 2023 was an incredible opportunity for Fintorro to connect with experts, traders, and investors from all over the world, and gain valuable insights into the latest trends and developments in the financial industry.
The talks and exhibition stands of other companies also drew in large crowds, showcasing the diversity and vibrancy of the trading industry. If you missed out on the London Trader Show conference this year, be sure to mark your calendar for next year’s event!
We look forward to attending future events and continuing to educate and inspire people about the world of trading and investing.
Next Read: FinTorro Mobile App