Bearish Belt Hold Lines

Bearish Belt Hold Lines

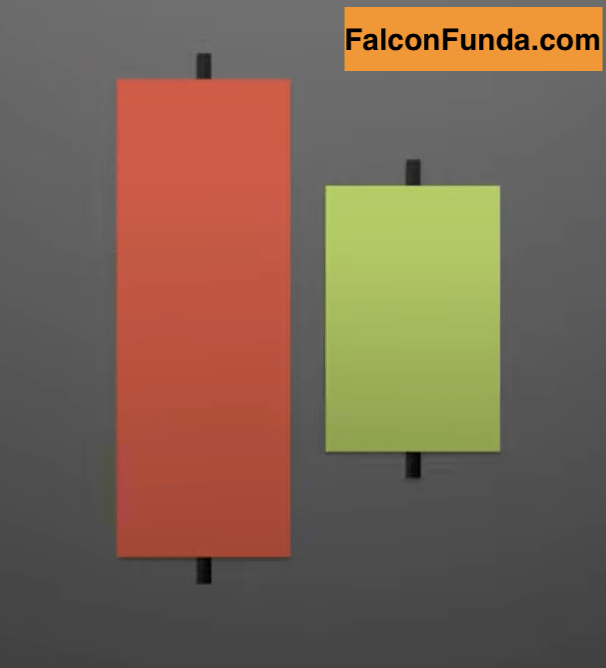
Introduction Bullish Belt hold lines is a one day candlestick pattern. It is a single candlestick pattern that occurs during a downtrend and signifies a potential reversal or continuation of the bullish trend. What is Bullish Belt Hold Lines Candlestick pattern? A...

Bullish Harami

Bullish Harami

  The Bullish  Harami  pattern is a two day pattern. It is made with one bullish candlesticks and a bearish candlestick. This is a potential trend reversal pattern and it is not as significant as a engulfing pattern or hammer.  First day a ...

Dark Cloud Cover

Dark Cloud Cover

The Dark Cloud Cover is a two day pattern. It is made with one large bullish candlesticks and a large bearish candlestick. This is a trend reversal pattern which occurs on top of an uptrend.  Dark Cloud Cover is also called Bearish Piercing Line.  First day...

Support and Resistance

Support and Resistance

Support and Resistance is a technical analysis concept / strategy used by traders to refer to the price levels on the charts for a security. On a chart, resistance is the area around the highest point the price of a security reaches before it is pulled back i.e prices...

Market Sentiment

Market Sentiment

Market Sentiment is the overall consensus about a particular security or market in general. This can be one of Bullish, Bearish or Correction.  A bullish sentiment describes a market condition when prices are on the rise or expected to grow. The phrase...

Transaction Costs

Transaction Costs

Transaction costs are  incurred by a trader during buying and selling  a security. These costs are on top of the price of the security that is being bought or sold.Depending on the type of the security, transaction costs can include broker/ commission fee,...

Volume

Volume

Volume is the total quantity of a particular security traded during trading hours on a given day or per transaction. For a given security, higher day trading volumes are considered more positive than the lower trading volumes because they mean more liquidity and...

Orders

Orders

In Trading an order is a set of instructions to a broker to buy or sell an asset on a trader's behalf. An order can be used to buy and sell securities like stocks, currencies, futures, commodities, options, bonds and other securities. Exchanges trade securities...

Buying and Selling

Buying and Selling

When you place a trade, you are either buying or selling a security in the market. Buyers who are buying believe  the security value will likely rise. Sellers ( or Bears ) generally think its value is going to fall.  Buyers and sellers affect the supply...

Market Price

Market Price

In trading, price is the most recent price at which a particular security was bought or sold.The price of the security is mainly determined by the supply and also demand. Traders, Investors and Dealers interact in the market to determine the supply and demand which in...

Securities

Securities

Security is a tradable financial asset that holds some type of monetary value. Securities are broadly categorized into: Debt securities (Example :  banknotes, bonds, and debentures Equity securities (Example  stocks) Derivatives (Example : , forwards,...

Brokers

Brokers

A  broker is an individual or a company who facilitates financial transaction execution on behalf of a trader. They basically act as sales agents.  There are mainly four types of broker in financial trading Stock broker : Stock broker manages and executes...

Bullish and Bearish Counterattack Candlestick Pattern

Bullish and Bearish Counterattack Candlestick Pattern

Introduction Bullish Counterattack Lines is a two-day trend reversal pattern with one bullish candlestick and a bearish candlestick.   What is Bullish Counterattack Candlestick  pattern? A bullish counterattack line or bullish meeting line occurs during a...

Doji

Doji

The Doji  is a single day pattern. It is a single candlestick where the open and close price is equal or very close to be the same.  Doji indicates indecision in the market and is considered as a trend reversal pattern.  Psychology of Doji pattern...

Dragonfly Doji

Dragonfly Doji

The Dragonfly Doji is a single day pattern. It  has a ‘T’ shape. This occurs when the open and close are the same and there is a long lower shadow and no upper shadow. Having a very small upper shadow is OK. Dragonfly Doji indicates indecision in the market and...

Exchanges

Exchanges

An exchange is a physical location or virtual / electronic based which provides opportunities for traders for buying and selling financial assets like Shares, Forex, Indices, Commodities, Crypto currencies. Shares -These are small units of  ownership in a...

Evening Star

Evening Star

The Evening Star is a three day pattern i.e it has three candlesticks.  The first day is a long bullish candlestick after a preceding uptrend.  Second day is a little  bullish or bearish candlestick. It gaps up i.e opens at a higher price than the...

Hanging man

Hanging man

The Hanging Man is a single day pattern. It has a none or very little upper shadow and the real body is towards the top of the candlestick. Real body itself can be bullish or bearish. For real impact, the lower shadow of the hanging man should be at least two times...

Hammer

Hammer

The Hammer is a single day pattern. This occurs when the price of the asset being traded  goes down significantly lower than the opening price and then bounces back on the same day to close near the opening price. Hammer Candlestick has a small real body and long...

Gravestone Doji

Gravestone Doji

The Gravestone Doji is a single day pattern. This occurs when the open and close are at the bottom. Candlestick has a long upper shadow and no lower shadow.. It is OK for Gravestone Doji  to have a very small lower shadow.  Gravestone Doji is considered as a...