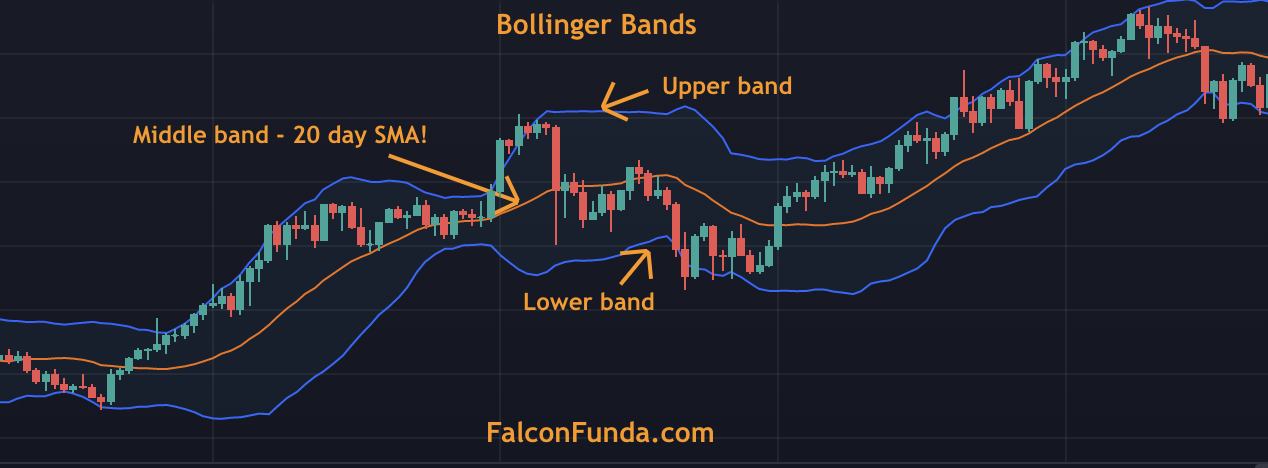
Tower Top and Tower Bottom Pattern

Tower Top and Tower Bottom Pattern

Introduction Tower Top and Tower Bottom are multi-day trend reversal candlestick patterns that traders use to identify potential reversals in the market. What is Tower Top Candlestick pattern? The Tower Top pattern occurs after an uptrend. On Day 1, there is a longer...

Tri-Star Pattern

Tri-Star Pattern

The Tri-Star Candlestick Pattern is a three day trend reversal pattern which has three doji’s. A Tri-star Top pattern happens after a uptrend. Day one is a doji. Second day is Doji again that gaps up above the day 1 open & close price. Day 3 is also doji and it is...

Advance Block Pattern

Advance Block Pattern

The Advance Block candlestick pattern is a three-day formation. Introduction : The Advance Block candlestick pattern consists of three consecutive bullish candles. • While the security is making new highs, the real bodies of the bullish candles are getting...

Top 10 people to follow in crypto & blockchain

Top 10 people to follow in crypto & blockchain

Here are some important people who significantly contribute to crypto and blockchain technologies. Click on the links to read more: Vitalik Buterin - Co-founder of Ethereum Andre Cronje - Founder of Yearn.finance Kris Marszalek - Founder of Crypto.com Changpend Zhao -...

How to handle and avoid trading burnout ?

How to handle and avoid trading burnout ?

Trading & Investing in financial markets is now easier than ever for retail traders with financial markets open 24 * 7. Don’t be surprised if you will feel burnt out at some point as Trading & Investing can be hazardous to your wealth and also health! Here are...

Market Crash 2022

Market Crash 2022

So financial markets have crashed this week and are still very volatile. Here are the most important things you need to know about the market crash. Market Crash Definition: A market crash happens when indexes ( S&P 500, Dow Jones ) and individual securities (...

Relative Strength Index(RSI)

Relative Strength Index(RSI)

Relative Strength Index (RSI )is a technical analysis momentum indicator used by traders /investors to identify extent of price movements and general trend in financial securities.  The RSI indicator on the price chart usually has a single line (RSI line). RSI...

How to create a trading plan as a beginner ?

How to create a trading plan as a beginner ?

By failing to prepare, you are preparing to fail.” - Benjamin Franklin Trading/Investing is a professional activity. It involves making decisions regularly. The trading plan will act as a reference document for a trader to make these decisions. You can use...